Victorian Resources Online (archived)
Profile Number 50
| Laboratory number: | 0997 | 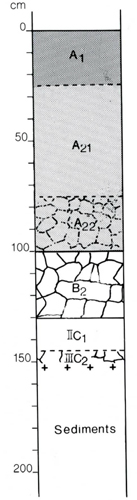 | Profile Description | ||
| Site number: | 709 | A1 | 0-25 cm | Very dark grey (10YR 3/1) loam; weak subangular blocky structure; rough-ped fabric; slightly hard when dry; pH 5.0; gradual boundary | |
| Classification: | Northcote (1979) – Dy3.21 Stace et al (1972) - Soloth | A21 | 25-75 cm | Dark greyish brown (10YR 4/2) sandy clay loam; few faint yellowish brown mottles; apedal; hard when dry; pH 5.5; gradual boundary | |
| Location: | Moe 8121, grid ref. 475572 2 km SW of Churchill | A22 | 75-100 cm | Greyish brown (10YR 5/2) sandy clay loam; common distinct yellowish brown (5-15 mm) mottles; weak angular blocky structure; rough-ped fabric; hard when dry; pH 6.5; clear boundary | |
| Land system, component: | Westbury 2, 2 | B2 | 100-130 cm | Greyish brown (10YR 5/2) sandy clay; common distinct yellowish brown (5-15 mm) and pale brown mottles; strong angular blocky structure; smooth-ped fabric; very hard when dry; pH 7.0; clear boundary | |
| Topography: | Mid-slope of rise, 6% slope | IIC | 130-145 cm | Yellowish brown (10YR 5/6) clayey coarse sand; apedal; soft when dry; pH 7.0; gradual boundary | |
| Elevation: | 60 m | IIIC | 145-150+ cm | Greyish brown (10YR5/2) heavy clay; common yellowish brown and pale brown (5-15mm) mottles; strong angular blocky structure; smooth-ped fabric; firm when moist; pH 7.0 | |
| Drainage: | Moderately good | ||||
| Parent material: | Tertiary and Pleistocene sediments | ||||
| Vegetation: | Cleared: a few remnant trees of Eucalyptus radiata and introduced grasses | ||||
| LABORATORY ANALYSES 997 | |||||||||||||||||||
Horizon | Sample Depth cm | Lab. texture | Particle size distribution | Atterberg limits | 1:5 soil water suspension | Clay mineralogy by x-ray diffraction | |||||||||||||
Gravel % | Coarse sand % f.e. | fine sand % f.e. | Silt % f.e. | Clay % f.e. | liquid limit % | plastic limit % | plasticity index % | linear shrinkage % | pH | EC 25°C µS/cm | Cl- % | Depth cm | Composition % | ||||||
A1 | 0-10 | L | 3 | 11 | 46 | 19 | 16 | 4.9 | 87 | 0.004 | |||||||||
A21 | 30-60 | L | 4 | 13 | 50 | 25 | 15 | 19 | 13 | 6 | 4.0 | 5.2 | 130 | 0.011 | |||||
A22 | 75-90 | L | 3 | 13 | 51 | 20 | 16 | 19 | 13 | 6 | 5.0 | 5.9 | 250 | 0.031 | |||||
B2 | 100-120 | SiCL | 2 | 10 | 44 | 14 | 29 | 33 | 15 | 18 | 11 | 6.4 | 380 | 0.053 | |||||
Horizon | Sample Depth cm | Org. C % | Total N % | 1.3C N | Free Fe2O3 % | Available | HCl extract | Exchangeable cations | |||||||||||
P ppm | K ppm | P % | K % | Ca | Mg | K | Na | CEC | Ca % of CEC | Mg | K | Na | H | ||||||
Milliequivalents/100g | |||||||||||||||||||
A1 | 0-10 | 4.5 | 0.28 | 21 | 28 | 140 | 0.014 | 0.041 | 0.9 | 1.3 | 0.4 | 0.4 | 27.3 | 3 | 5 | 1 | 1 | 90 | |
A21 | 0.47 | 0.040 | 15 | 0.5 | 5 | 60 | 0.003 | 0.032 | 0.4 | 1.4 | 0.1 | 0.7 | 9.4 | 4 | 15 | 1 | 7 | 73 | |
A22 | 75-90 | 0.8 | 0.4 | 2.5 | 0.03 | 1.2 | 7.5 | 5 | 33 | <1 | 16 | 46 | |||||||
B2 | 100-120 | 0.5 | 0.9 | 7.5 | 0.1 | 3.5 | 14.0 | 6 | 54 | 1 | 25 | 14 | |||||||