Victorian Resources Online (archived)
Profile Number 54
| Laboratory number: | 0960 | 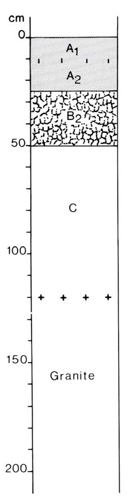 | Profile Description | ||
| Site number: | 478 | A1 | 0-10 cm | Dark brown (10YR 3/3) sandy loam; weak crumb structure; earthy fabric; soft when dry; pH 6.0; diffuse boundary | |
| Classification: | Northcote (1979) – Dr2.22 Stace et al (1972) – Red Podzolic Soil | A2 | 10-25 cm | Brown (10YR 4/3) sandy loam; apedal; hard when dry; porous; pH 6.5; clear boundary | |
| Location: | Stratford 8322, grid ref. 176432 12 km SW of Dargo and 2 KM NE of Castleburn | B2 | 25-50 cm | Dark red (2.5YR 3/6) sandy clay; weak fine (5 mm) angular blocky structure; smooth-ped fabric; very firm when moist; common weathered feldspar and mica; pH 6.5; clear boundary | |
| Land system, component: | Dargo, 2 | C | 50-120+ cm | Yellowish red (5YR 5/6) sandy clay loam; apedal; earthy fabric; firm when moist; pH 7.0 | |
| Topography: | 5% slope facing NE on broad crest of spur | ||||
| Elevation: | 290 m | ||||
| Drainage: | Excessively drained | ||||
| Parent material: | Palaeozoic granite | ||||
| Vegetation: | Grassy open forest II: Eucalyptus bridgesiana.Ground layer with Medicago spp., Bromus sp. and Danthonia sp | ||||
| LABORATORY ANALYSES 960 | |||||||||||||||||||
Horizon | Sample Depth cm | Lab. texture | Particle size distribution | Atterberg limits | 1:5 soil water suspension | Clay mineralogy by x-ray diffraction | |||||||||||||
Gravel % | Coarse sand % f.e. | fine sand % f.e. | Silt % f.e. | Clay % f.e. | liquid limit % | plastic limit % | plasticity index % | linear shrinkage % | pH | EC 25°C µS/cm | Cl- % | Depth cm | Composition % | ||||||
A1 | 0-10 | LS | 9 | 43 | 36 | 13 | 7 | 6.1 | 36 | 0.002 | |||||||||
A2 | 20-25 | L | 12 | 37 | 32 | 17 | 13 | 31 | 18 | 13 | 8.0 | 6.2 | 20 | 0.002 | |||||
B2 | 30-50 | CL | 13 | 31 | 25 | 15 | 29 | 52 | 19 | 33 | 13 | 6.6 | 23 | 0.002 | |||||
C | 60-90 | SL | 14 | 40 | 31 | 9 | 19 | 7.2 | 2.2 | 0.002 | |||||||||
Horizon | Sample Depth cm | Org. C % | Total N % | 1.3C N | Free Fe2O3 % | Available | HCl extract | Exchangeable cations | |||||||||||
P ppm | K ppm | P % | K % | Ca | Mg | K | Na | CEC | Ca % of CEC | Mg | K | Na | H | ||||||
Milliequivalents/100g | |||||||||||||||||||
A1 | 0-10 | 1.8 | 0.15 | 16 | 1.0 | 2 | 180 | 0.013 | 0.19 | 4.2 | 0.8 | 0.4 | <0.01 | 10.7 | 39 | 8 | 4 | <1 | 49 |
A2 | 20-25 | 0.19 | 0.025 | 10 | 1.9 | <1 | 80 | 0.008 | 0.27 | 3.6 | 1.7 | 0.2 | 0.2 | 9.4 | 38 | 18 | 2 | 2 | 50 |
B2 | 30-50 | 3.3 | 0.008 | 0.40 | 7.5 | 3.3 | 0.3 | 0.5 | 16.5 | 45 | 20 | 2 | 3 | 30 | |||||
C | 60-90 | 2.7 | 0.005 | 0.32 | 8.9 | 3.1 | 0.2 | 0.6 | 13.7 | 65 | 23 | 2 | 4 | 6 | |||||