Victorian Resources Online (archived)
Profile Number 67
| Laboratory number: | 0946 | 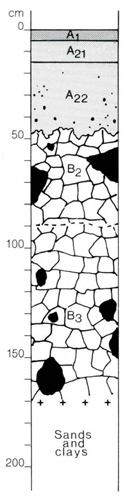 | Profile Description | ||
| Site number: | 393 | A1 | 0-5 cm | Very dark greyish brown (10YR 3/2) sandy loam; weak coarse (10 mm) crumb structure; rough-ped fabric; slightly hard when dry; abundant roots; pH 5.5; abrupt smooth boundary | |
| Classification: | Northcote (1979) – Dy3.42 Stace et al (1972) - Soloth | A21 | 5-15 cm | Light yellowish brown (10YR 6/4) fine sandy loam; common faint yellowish brown (5-15 mm) mottles; apedal; earthy fabric; very hard when dry; common roots; pH 5.8; clear smooth boundary | |
| Location: | Traralgon 8221, grid ref. 655868 2 km W of Toongabbie, 23 km NW of Rosedale | B2 | 47-90 cm | Yellowish brown (10YR 5/8) medium clay; common distinct reddish brown (<5 mm) mottles; moderate coarse (20 mm) angular blocky structure; smooth-ped fabric; common roots; 2% (5 mm) mottles; common roots; 2% red chert fragments up to 300 mm; pH 6.0%; gradual wavy boundary | |
| Land system, component: | Westbury, 1 | B3 | 90-170+ cm | Yellowish brown (10YR 5/8) heavy clay; common distinct grey (5-15 mm) and reddish brown (<5 mm) mottles; moderate coarse (25 mm) angular blocky structure; smooth-ped fabric; very hard when dry; few roots; 2% quartz gravel up to 200 mm; pH 7.0 | |
| Topography: | 4% slope on low rise | ||||
| Elevation: | 80 m | ||||
| Drainage: | Poor | ||||
| Parent material: | Tertiary unconsolidated material of mixed texture | ||||
| Vegetation: | Open forest II: Eucalyptus globoidea, E. sideroxylon, E. mellioroda and E. goniocalyx | ||||
| LABORATORY ANALYSES 946 | |||||||||||||||||||
Horizon | Sample Depth cm | Lab. texture | Particle size distribution | Atterberg limits | 1:5 soil water suspension | Clay mineralogy by x-ray diffraction | |||||||||||||
Gravel % | Coarse sand % f.e. | fine sand % f.e. | Silt % f.e. | Clay % f.e. | liquid limit % | plastic limit % | plasticity index % | linear shrinkage % | pH | EC 25°C µS/cm | Cl- % | Depth cm | Composition % | ||||||
A1 | 0-5 | L | 0 | 10 | 33 | 23 | 15 | 4.6 | 110 | 0.011 | |||||||||
A21 | 10-15 | L | 1 | 24 | 40 | 23 | 13 | 4.4 | 50 | 0.006 | |||||||||
A22 | 30-47 | L | 4 | 26 | 33 | 23 | 17 | 5.0 | 55 | 0.005 | |||||||||
B2 | 47-60 | CL | 5 | 14 | 24 | 22 | 38 | 42 | 13 | 29 | 13 | 5.5 | 190 | 0.026 | |||||
B3 | 90-120 | C | 1 | 10 | 21 | 19 | 49 | 6.2 | 50 | 0.063 | |||||||||
Horizon | Sample Depth cm | Org. C % | Total N % | 1.3C N | Free Fe2O3 % | Available | HCl extract | Exchangeable cations | |||||||||||
P ppm | K ppm | P % | K % | Ca | Mg | K | Na | CEC | Ca % of CEC | Mg | K | Na | H | ||||||
Milliequivalents/100g | |||||||||||||||||||
A1 | 0-5 | 12.2 | 0.59 | 27 | 0.5 | 23 | 160 | 0.023 | 0.11 | 5.4 | 2.9 | 0.6 | 0.4 | 42.2 | 13 | 7 | 1 | 1 | 78 |
A21 | 10-15 | 0.74 | 0.036 | 27 | 0.6 | 10 | 30 | 0.029 | 0.029 | 0.3 | 0.4 | 0.1 | 0.2 | 7.6 | 4 | 5 | 1 | 3 | 87 |
A22 | 30-47 | 1.9 | 0.004 | 0.097 | 0.2 | 1.3 | 0.1 | 0.4 | 9.4 | 2 | 14 | 1 | 4 | 79 | |||||
B2 | 47-60 | 2.4 | 0.004 | 0.15 | 0.2 | 6.8 | 0.2 | 2.5 | 21.5 | 1 | 32 | 1 | 12 | 54 | |||||
B3 | 90-120 | 2.7 | 0.004 | 0.21 | 0.2 | 9.1 | 0.1 | 5.3 | 19.3 | 1 | 47 | 1 | 27 | 24 | |||||