Victorian Resources Online (archived)
EGS261
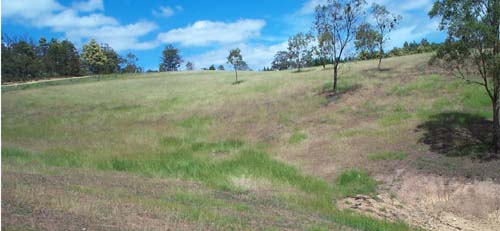
Location: Bruthen
Australian Soil Classification: Melacic, Eutrophic, Brown DERMOSOL
Map Unit: Tambo (Component 1)
Previous Site Name: EG261
General Landscape Description: Rolling to steep low hills.
Site Description: Upper slope
Land Use: Grazing on annual pasture
Native Vegetation: Valley dry forest
Geology: Ordovician sediments
Soil Profile Morphology:
Surface Soil
| A11 | 0 – 12 cm | Dark yellowish brown; fine sandy clay loam; few (10%) small angular pebbles (<20 mm); clear and wavy change to: | 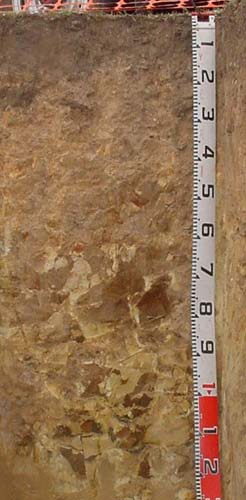 EG261 Profile |
| A12 | 12 – 35 cm | Yellowish brown; fine sandy clay loam (heavy); common (10-20%) angular pebbles (<60 mm) increasing with depth; gradual change to: | |
| A13 | 35 – 60 cm | Light brown; fine sandy clay loam (heavy); many (20-50%) angular pebbles and cobbles (<200 mm) increasing in size and amounts with depth; passing to: | |
Subsoil | |||
| R | 60+ cm | Weak rock becoming stronger with depth. |
Key Profile Features:
- Uniform textures to at least 60 cm.
Soil Profile Characteristics:
- | |||
Surface soil (A11 horizon) | Strongly Acid | Non-Sodic | None |
Subsurface (A12 horizon) | Strongly Acid | Non-Sodic | None1 |
Deeper subsoil (35 – 60 cm) | Strongly Acid | Non-Sodic | None2 |
Chemical and Physical Analysis:
Horizon | Horizon Depth (cm) | pH (water) | pH CaCl2 | CE dS/m | Organic Carbon % | Total Nitrogen % | Exch. Al | Exch. Acididty meq/100g | Exchangeable Cations | Coarse Sand (0.2-2.0 mm) % | Fine Sand (0.02-0.2 mm) % | Silt (0.002-0.02 mm) % | Clay (<0.002 mm) % | Field cap. % w/w | Wilt. point % w/w | |||
Ca | Mg | K | Na | |||||||||||||||
meq/100g | ||||||||||||||||||
A11 | 0-12 | 5.4 | 4.7 | 0.07 | 5.7 | 0.35 | 71 | 17 | 7.1 | 1.8 | 0.4 | <0.1 | 16 | 30 | 26 | 17 | 37.6 | 12.1 |
A12 | 12-35 | 5.2 | 4.4 | <0.05 | 200 | 13 | 1.4 | 1.3 | 0.3 | <0.1 | 15 | 32 | 31 | 18 | 27.1 | 8.6 | ||
A13 | 35-60 | 5.3 | 4.4 | <0.05 | 190 | 9.1 | 0.9 | 1.8 | 0.2 | <0.1 | 17 | 33 | 28 | 21 | 22.1 | 8.3 | ||
Management Considerations
Whole profile
- The brown colours throughout and lack of texture contrast indicate the profile is well drained internally.
- The soil texture is almost uniform throughout.
Surface (A11) horizon
- The soil has a high organic matter content conferring good structural stability.
- The nutrient holding capacity of the soil is moderate (based on the sum of exchangeable cations).
- The potassium levels are marginal but the soil is unlikely to show a response to potassium fertilisers at this stage.
Subsurface soils
- The presence of increasing amounts of rock in the subsoil is likely to restrict root development.
Profile Described By: Ian Sargeant (2011).