Victorian Resources Online (archived)
Archived content — This page contains material from the Victorian Resources Online (VRO) website. It is no longer maintained and is provided for reference only. This content is hosted by CeRDI and is not endorsed by Agriculture Victoria.
Sitemap
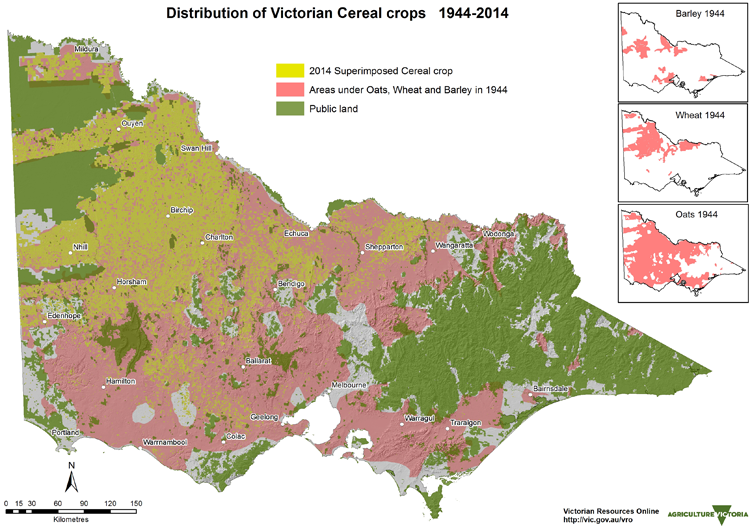
Distribution of Victorian Grains Growing Regions 1944 to 2014
Back to: Grain Industry homepage
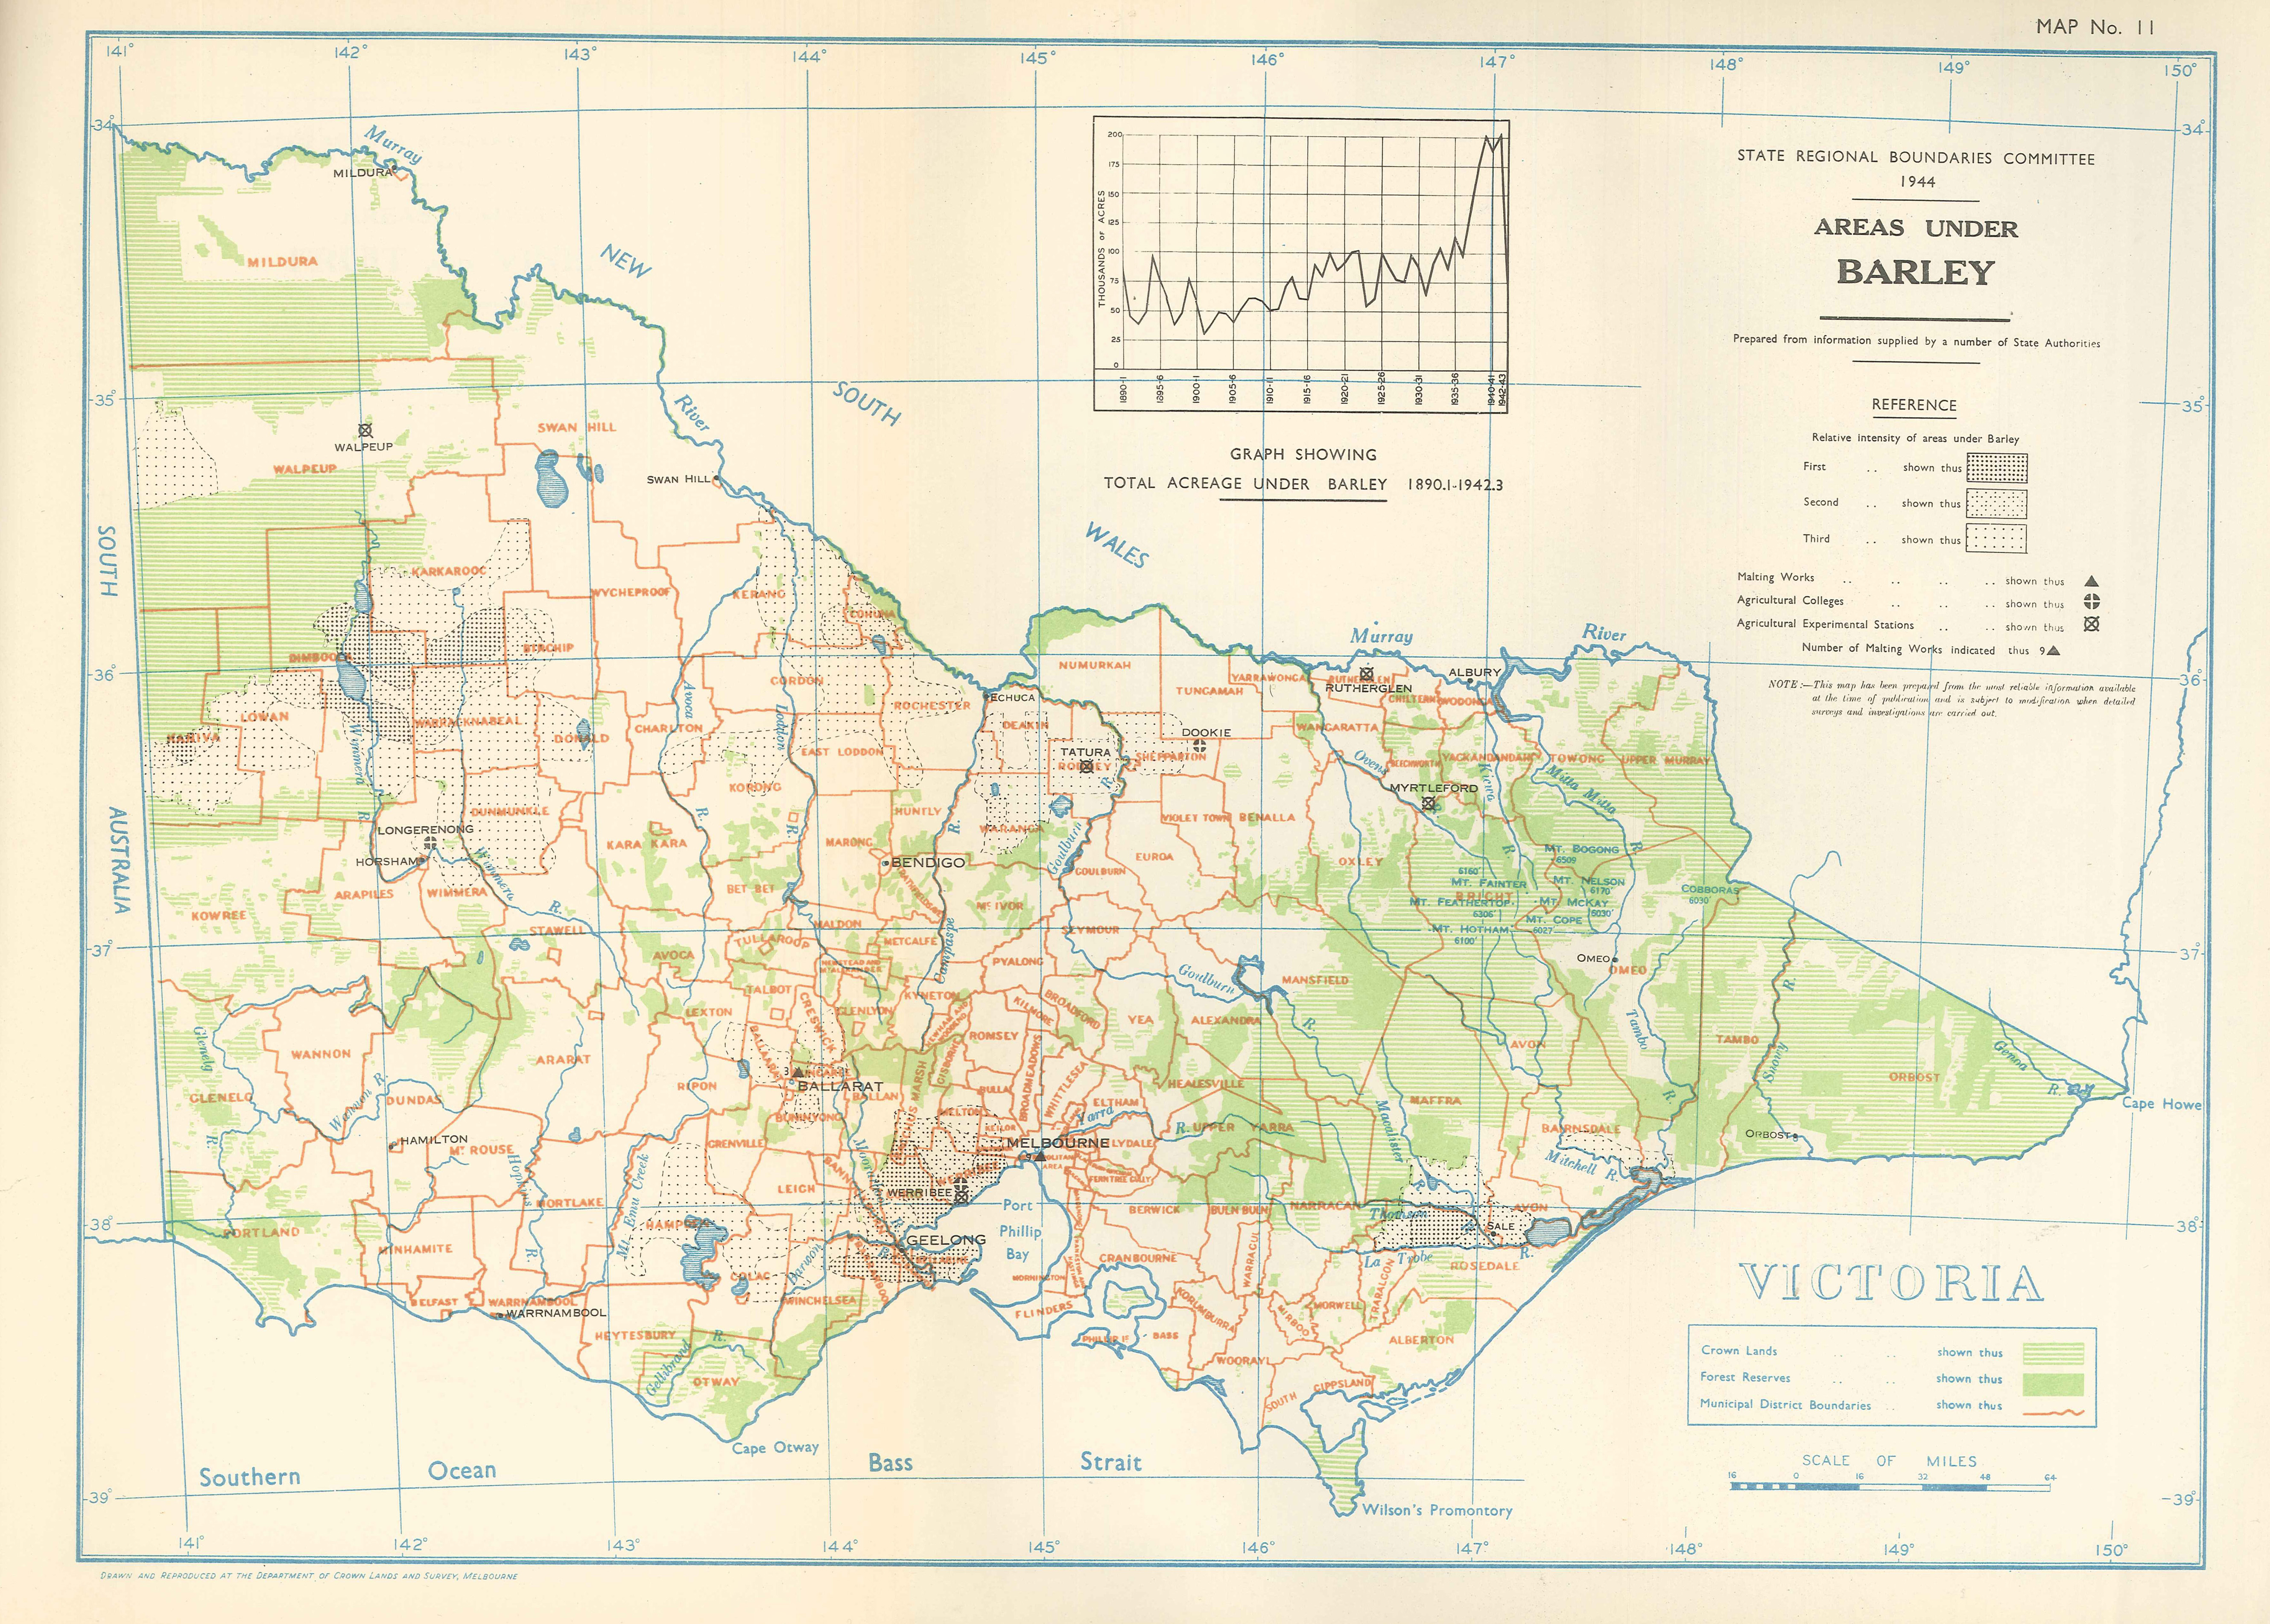
This new map provides a useful spatial view of the change in distribution of grain cropping over a 70 year period - from 1944-2014. The distribution of cropping in 1944 was obtained from three maps produced for the former State Regional Boundaries Committee's 'Report on Regional Boundaries' that shows the distribution of oats, barley and wheat as well as associated infrastructure (e.g. mills and grain elevators).
Superimposed over this map (in red shading) is the estimated 2014 distribution of grain cropping in Victoria obtained from the Victorian Land Use Information System (VLUIS). VLUIS data is a combination of satellite image interpretation as well as data from other government sources. The area of grain cropping has been produced by applying a 1 km buffer around polygons sourced from VLUIS. It should be noted that not all grain-cropping farms may be represented in this 2014 mapped area and the map product will be improved on over time as new data becomes available.
Distribution of Victorian Cereal Crops 1944 to 2014 (PDF - 4MB)
The high resolution PDF file provided on this page can be viewed using the free Adobe PDF reader and this software can be installed from the Adobe website (external link). This PDF is provided with a high level of detail and with the intent that it should be printed at a high resolution.
| Area under oats 1944 – intensity of areas under oats, including location of chaff and oatmeal mills. | 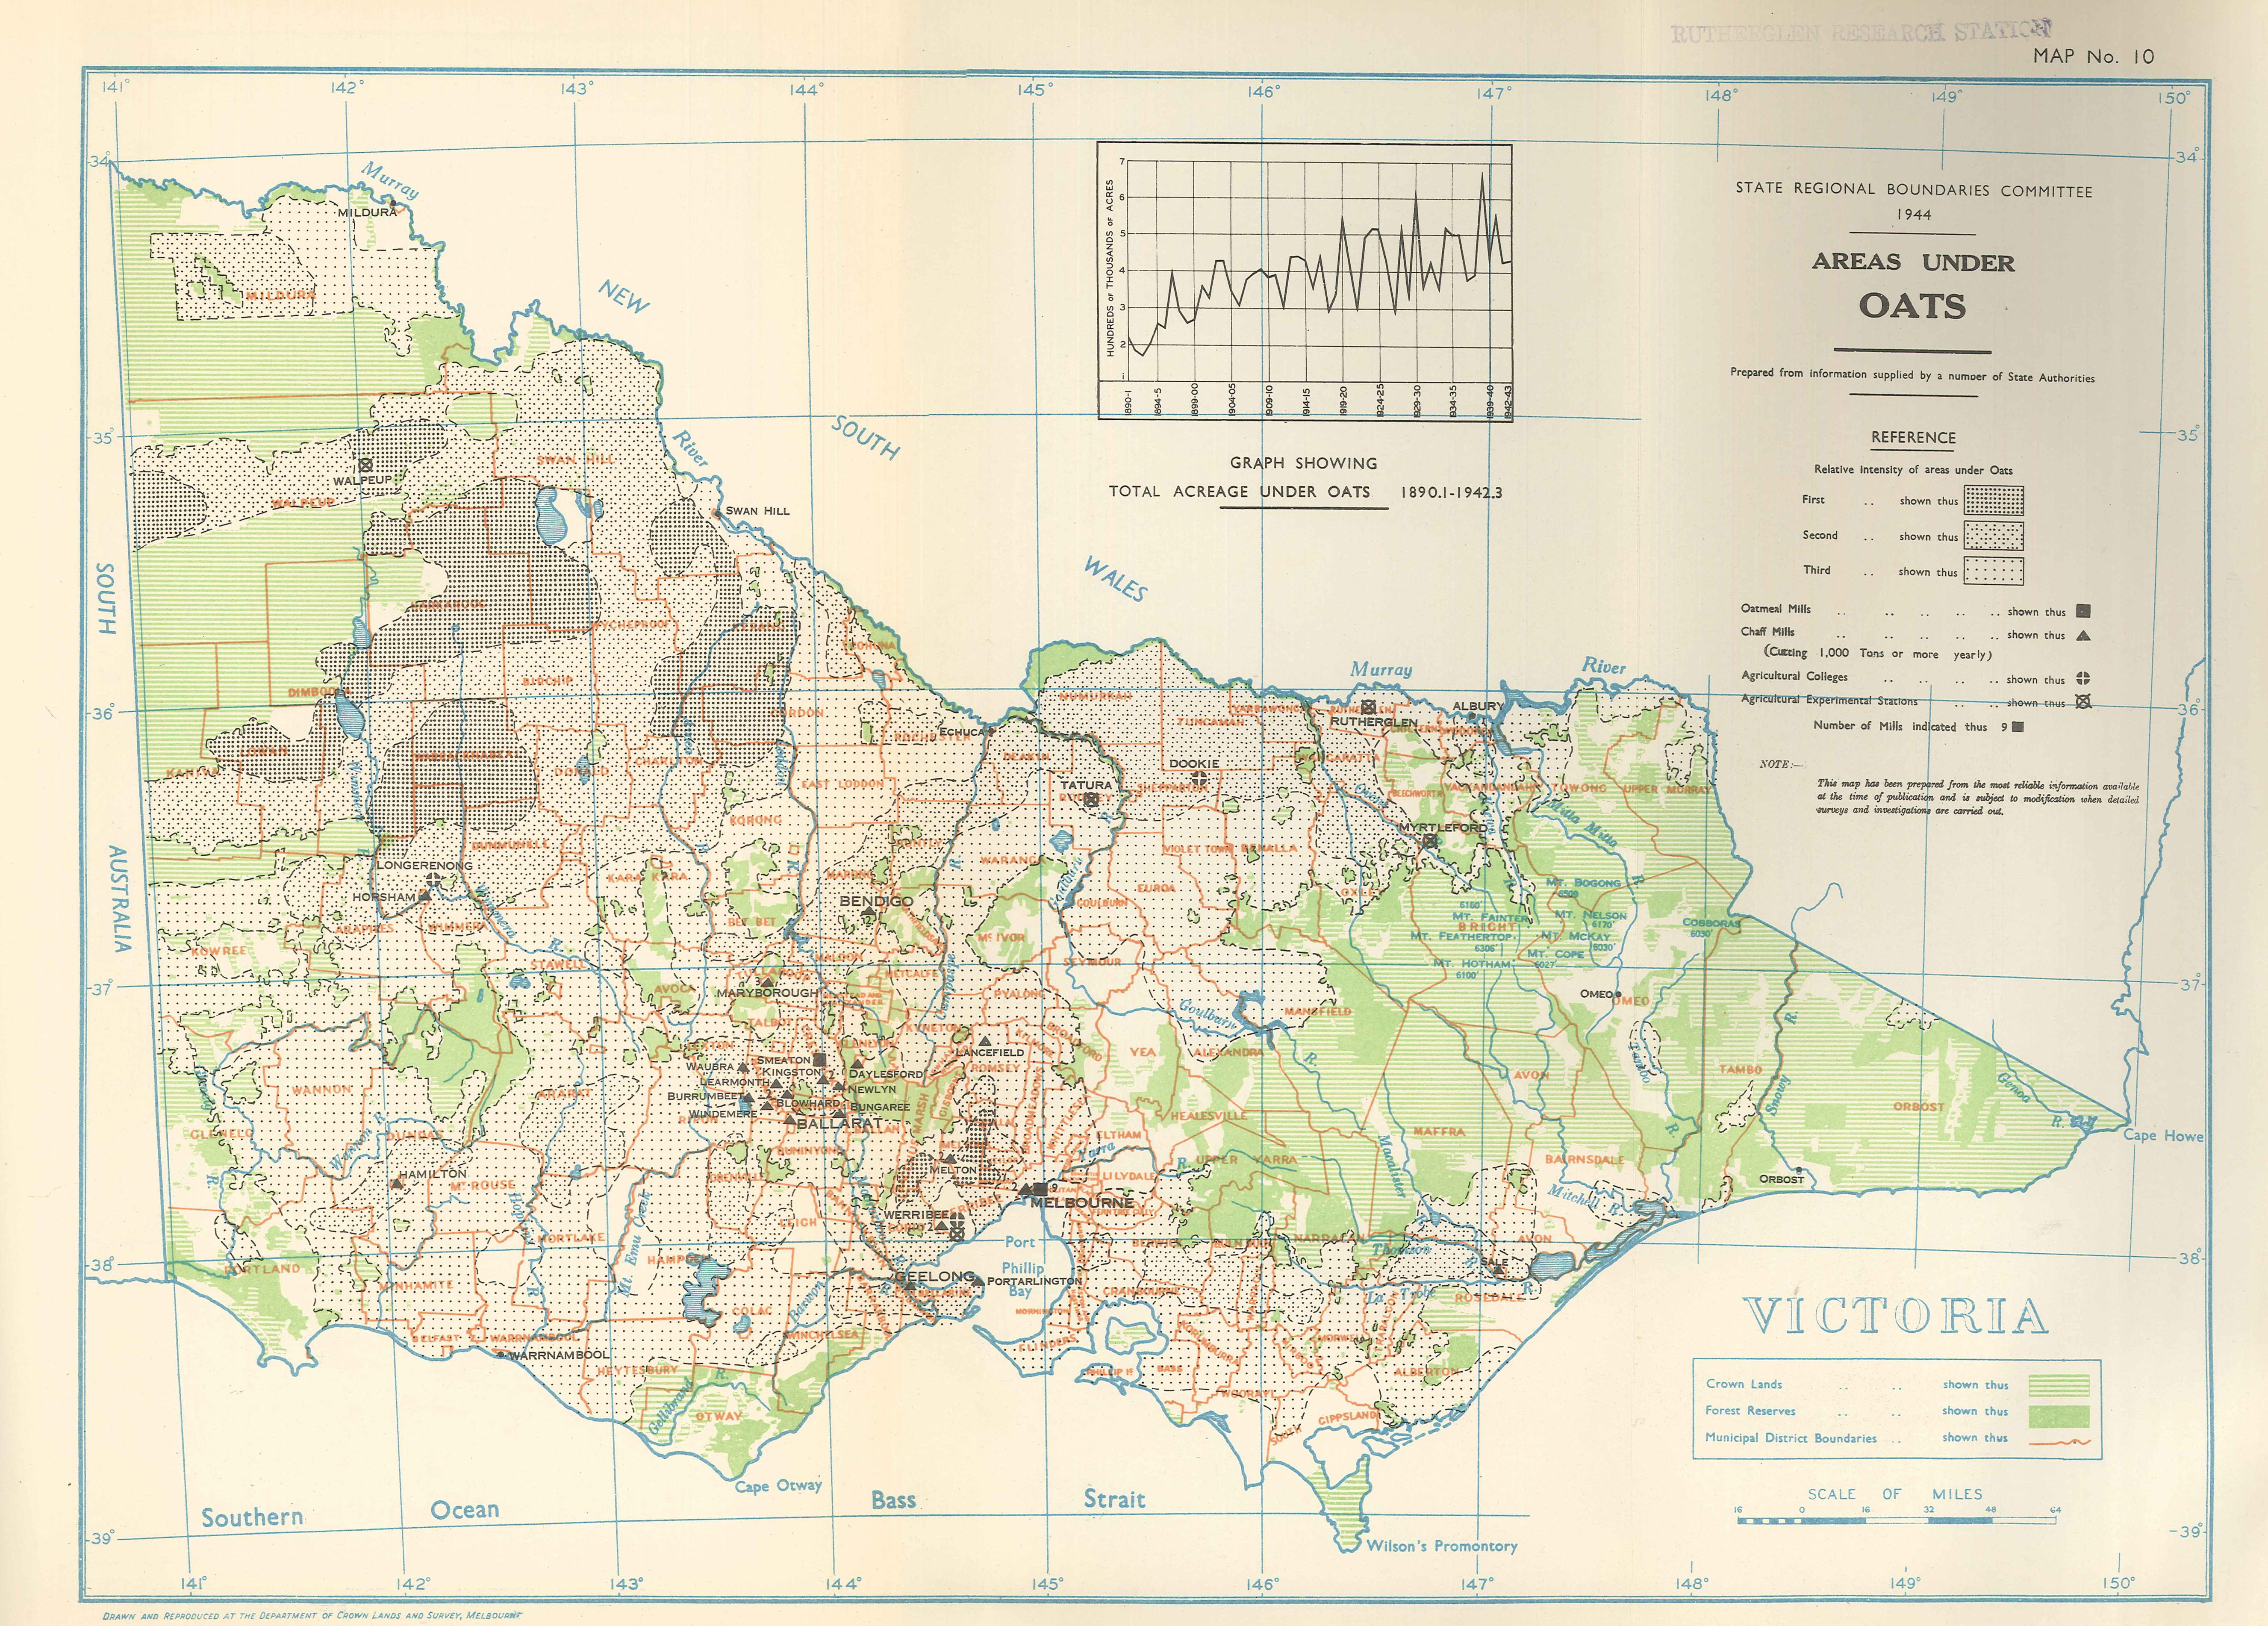 |
| Area under wheat 1944 – intensity of areas under wheat, including location of grain elevators, flour mills, alcohol distilleries, agricultural colleges and agricultural experimental stations. | 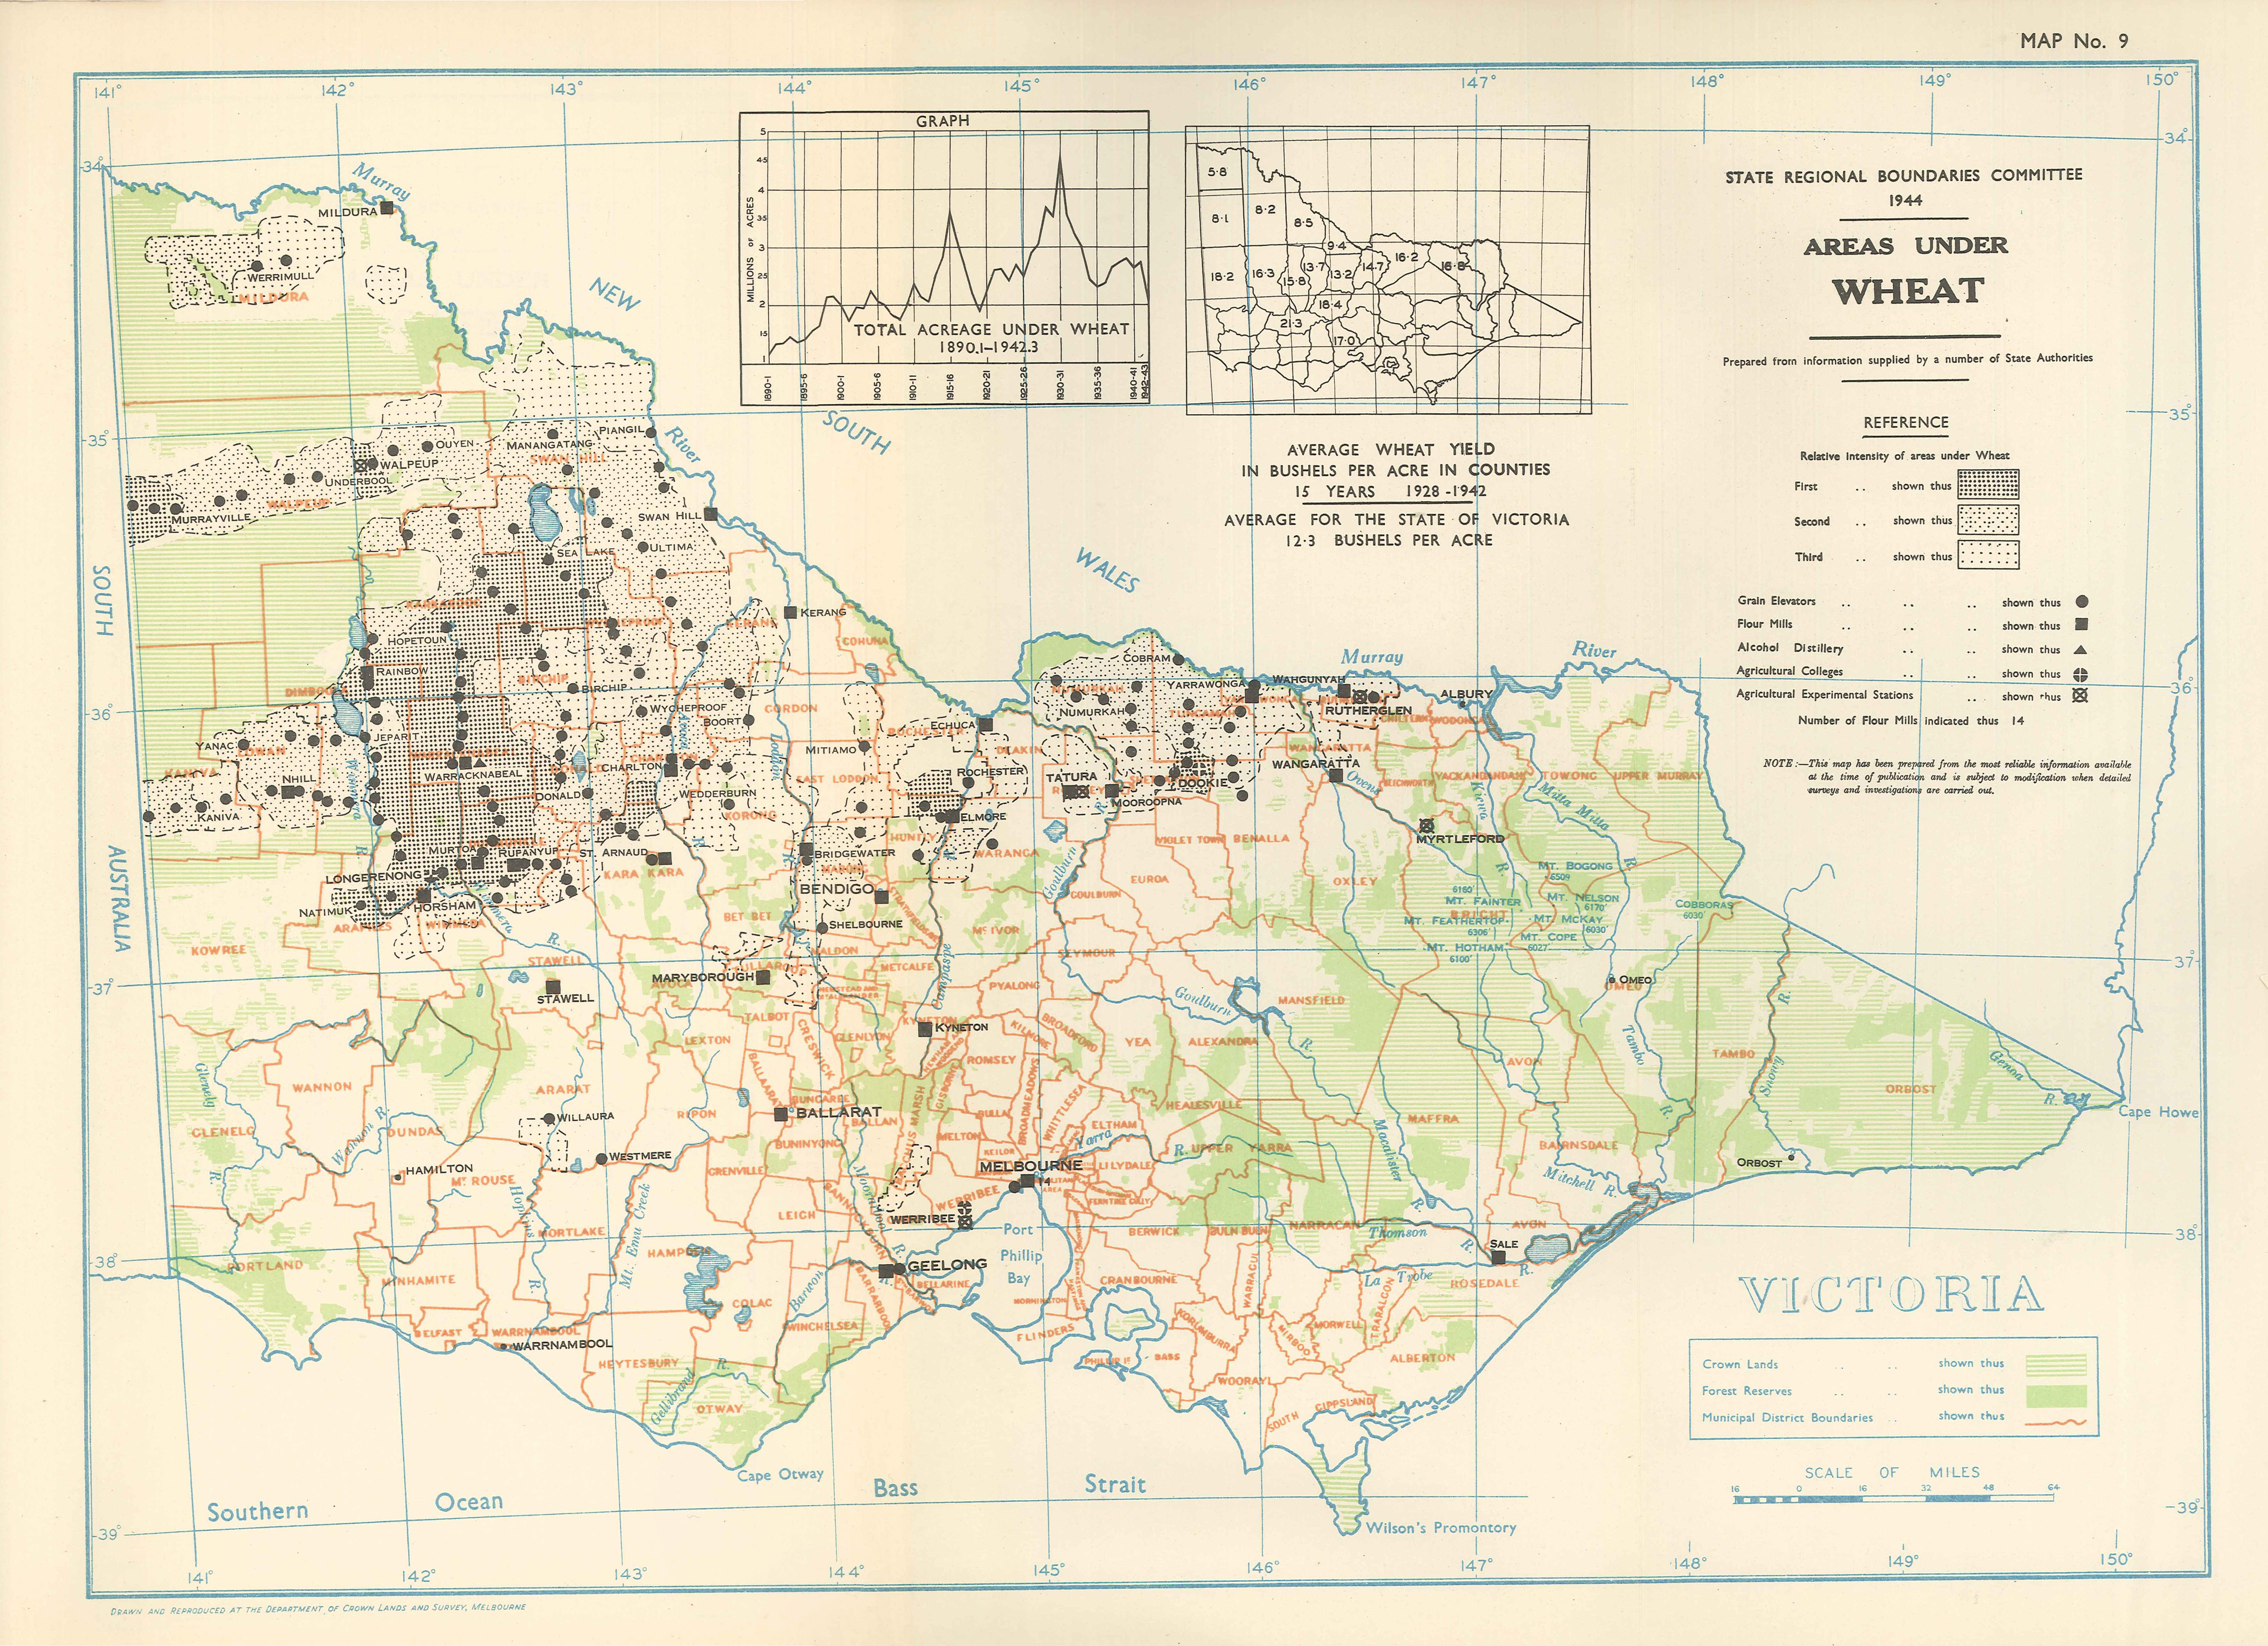 |