Victorian Resources Online (archived)
GP34
| Location: Toongabbie. | Australian Soil Classification: Eutrophic, Mottled-Hypernatric, Brown SODOSOL. |
| Great Soil Group: Solodic. | Geology: Pleistocene alluvial deposits. |
| General Landscape Description: Level plain. | Mapping Unit: Stratford. |
| Site Description: Road reserve. | Native Vegetation: The original vegetation included yellow box and red stringybark. |
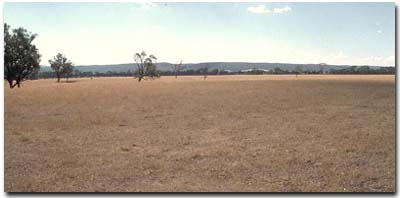 Site GP34 Landscape |
Soil Profile Morphology:
Surface Soil
| A1 | 0-5 cm | Dark brown (10YR3/3); fine sandy loam; weak medium blocky structure; weak to firm consistence dry; pH 5.7: | 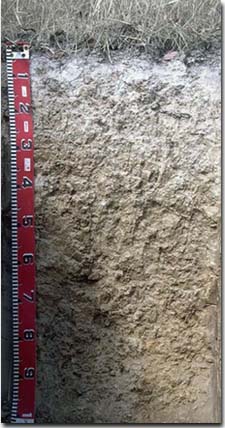 Site GP34 Profile |
| A2 | 5-20 cm | Pale brown (7.5YR7/4) conspicuously bleached (10YR8/2d); fine sandy loam; pH 5.7; abrupt change to: | |
| Subsoil | |||
| B21 | 20-70cm | Yellowish brown (10YR5/4) with slight brownish yellow (10YR6/8) mottles [at depth the colour becomes yellowish brown (10YR5/6) with some red (2.5YR5/8) mottles]; medium heavy clay; strong coarse blocky, parting to moderate medium blocky structure; very strong consistence dry; pH 7.8: | |
| B22 | 70-100 cm | Brownish yellow (10YR6/6) with light brownish yellow (10YR6/8) mottles; light clay; strong coarse blocky structure; pH 8.5. | |
Key Profile Features:
- Strong texture contrast between surface (A) horizon (13% clay) and strongly sodic subsoil (B21) horizon (44% clay).
- Conspicuously bleached subsurface (A2) horizon.
Horizon | pH | Salinity Rating | ||
Surface (A1 horizon) | Moderately Acid | Low | Non-Sodic | None1 |
Subsoil (B21 horizon) | Slightly Alkaline | Low | Strongly sodic | Complete |
Deeper subsoil (at 90 cm) | Moderately Alkaline | Medium | Strongly sodic | Complete |
 | The surface is moderately acid. The subsoil is slightly alkaline; becoming moderately alkaline at 60 cm. |  | The subsoil is strongly sodic throughout. |
 | The salinity rating is low; becoming moderate at 1 metre depth. |  | The clay content increases significantly at the A/B horizon interface. |
Horizon | Horizon Depth (cm) | pH (water) | pH (CaCl2) | EC 1:5 | NaCl | Exchangeable Cations | |||
Ca | Mg | K | Na | ||||||
meq/100g | |||||||||
A1 | 0-5 | 5.7 | 4.7 | 0.07 | 2.5 | 2.2 | 0.3 | 0.34 | |
A2 | 5-20 | 5.7 | 4.6 | 0.11 | 1.2 | 2.8 | 0.29 | 0.83 | |
B21 | 20-70 | 7.8 | 6.8 | 0.31 | 0.07 | 1.9 | 7 | 0.3 | 3.1 |
B22 | 70-100 | 8.5 | 7.4 | 0.4 | 0.08 | 1.7 | 7.1 | 0.2 | 4 |
B23 | 100+ | 7.5 | 7.2 | 2.6 | 0.66 | 0.6 | 7.6 | 0.2 | 5.7 |
Horizon | Horizon Depth (cm) | Wilting Point pF4.2 | Coarse Sand (0.2-2.0 mm) | Fine Sand (0.02-0.2 mm) | Silt (0.002-0.02 mm) | Clay (<0.002 mm) |
A1 | 0-5 | 7 | 9 | 51 | 24 | 13 |
A2 | 5-20 | 7 | 5 | 50 | 25 | 19 |
B21 | 20-70 | 16 | 3 | 33 | 18 | 44 |
B22 | 70-100 | 17 | 3 | 33 | 18 | 46 |
B23 | 100+ | 4 | 25 | 25 | 46 |
Management Considerations:
Whole Profile
- Plant Available Water Capacity (PAWC) is considered to be low for this profile as effective rooting depth will be limited to the surface horizons due to the dense and coarsely structured nature of the strongly sodic subsoil.
- The surface (A1) horizon has a very high fine sand and silt content. Soils such as these rely to a large extent on organic matter for maintaining aggregation.
- The nutrient holding capacity of the surface horizons is low (based on the sum of the exchangeable basic cations). Organic matter is also important for nutrient storage on such soils.
- The surface (A1) horizon is non-sodic. Moderate dispersion occurs after remoulding, indicating that structural degradation (eg. surface sealing, increased cloddiness) may occur if the soil is cultivated or overstocked in a moist to wet condition. Also, raindrop action on bare surface soil may also promote dispersion. Surface cover should be maintained to protect against raindrop damage.
- The low wilting point value (7%) of the surface (A1) horizon indicates that plants will be able to utilise very light rains when the soil is dry. However, due to the low water storage capacity, plants will soon suffer moisture stress unless further rainfall occurs.
- Infiltration will be high in the surface (A1) horizon due to the high sand content. However, in the subsurface (A2) horizon the presence of conspicuous bleaching indicates that periodic waterlogging occurs above the more slowly permeable subsoil. This bleached horizon is likely to become ‘spewy’ when saturated.
- The coarsely structured upper subsoil is strongly sodic (with a low exchangeable calcium to magnesium ratio of 0.3) and complete dispersion occurs in water. Root and water movement will be significantly restricted in the subsoil due to these conditions. Deep ripping with gypsum application, has been advocated by some researchers as an effective ameliorating technique for sodic subsoils. However, this may not be an economical alternative. Deep ripping should not be carried out if the subsoil is in a moist-wet condition.
- The subsoil is mottled throughout which indicates imperfect subsoil drainage.
- The subsoil becomes moderately saline at about 1 metre depth which may restrict the growth of deeper-rooted salt sensitive plant species.