Victorian Resources Online (archived)
Toongabbie (Tg)
| Geology Early Pleistocene to Late Pliocene alluvial sediments (Warragul 1:250 000 Geology sheet). Following the notation of VandenBerg and O’Shea (1981), these sediments are believed to be mostly Qp5 with some later alluvium from the streams emerging from the hills to the west (see Geology and Geomorphology). |
 |
 |
Landform Level plain. This plain is only weakly dissected. Where it adjoins the Stratford map unit, it appears to be slightly lower in the landscape. This has caused the northern-most drainage lines emerging from the hills to flow north across the Toongabbie map unit into the Thomson River. | 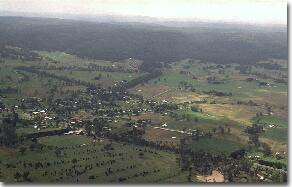 Part of the Toongabbie mapping unit from the air. |
Mostly red gum, with stringybark and box adjoining the hills to the west.
Previous Maps and Reports
This area has been mapped by Aldrick et al. (1992) as Westbury 1, Redgum 1 and Redgum 2 Land Systems.
Soils
Most of the soils are generally identical to those described for the Stratford map unit. Part of the Toongabbie map unit appears to have received latter alluvium. These soils are generally classified as Yellow or Brown Sodosols using the Australian Soil Classification.
Chemical and Physical Analysis
No pits were dug on this map unit. These soils are believed to be similar in chemical properties to the soils of the Stratford map unit. Analyses at one site just off this map sheet have been reported in Aldrick et al. (1992) and is provided below.
Profile 67, Red Gum 1,2 (Aldrick et al., 1992)
Depth cm | Texture | pH | EC dS/m | Cl % | Nitrogen % | Carbon % | Ca meq% | Mg meq% | K meq% | Na meq% | H meq% | ESP % | Gravel % | Coarse sand % | Fine sand % | Silt % | Clay % |
0-5 | SL | 4.6 | 0.11 | .011 | 0.59 | 12.2 | 5.4 | 2.9 | 0.6 | 0.4 | 32.9 | 1 | 10 | 33 | 23 | 15 | |
10-15 | FSL | 4.4 | 0.05 | .006 | 0.036 | 0.74 | 0.3 | 0.4 | 0.1 | 0.2 | 6.6 | 3 | 1 | 24 | 40 | 23 | 13 |
30-47 | SCL | 5.0 | 0.06 | .005 | 0.2 | 1.3 | 0.1 | 0.4 | 7.4 | 4 | 4 | 26 | 33 | 23 | 17 | ||
47—60 | MC | 5.5 | 0.19 | .026 | 0.2 | 6.8 | 0.2 | 2.5 | 11.8 | 12 | 5 | 14 | 24 | 22 | 38 | ||
90-120 | HC | 6.2 | 0.53 | .063 | 0.2 | 9.1 | 0.1 | 5.3 | 4.6 | 27 | 1 | 10 | 21 | 19 | 49 |
The following abbreviations are used to describe field texture: S - sand; LS - loamy sand; ClS - clayey sand; SL - sandy loam; L - loam; CL - clay loam; SCL - sandy clay loam; SC - sandy clay; FSCL - fine sandy clay loam; FSC - fine sandy clay; LC - light clay; MC - medium clay; HC - heavy clay; GR - gravel; ZL - silty loam; ZCL - silty clay loam; ZLC - silty light clay; ZMC - silty medium clay.
Aldrick et al. (1992) does not provide LAT data.
Other symbols include: pH - analysed in water; EC - electrical conductivity; Cl - chloride; Ca - exchangeable calcium; Mg - exchangeable magnesium, K - exchangeable potassium; Na - exchangeable sodium; H - exchangeable hydrogen; ESP - exchangeable sodium percentage.
Land Use
These soils tend to be waterlogged in wetter months and dry out rapidly in summer. They are mostly used for grazing.