Victorian Resources Online (archived)
Wooundellah (Wo)
| Geology Late Pleistocene sediments. Landform Level plain. Skene and Walbran (1948) call the area covered by this map unit “intermediate slopes” placing it higher in the landscape than the Denison map unit. |
 |
 |
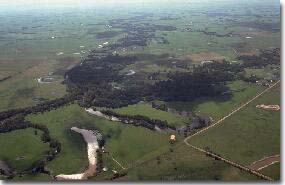 |
Area of the Wooundellah map unit south-west of the junction of the Thomson and the Macalister Rivers. |
Original Vegetation
Lunt (1997) concludes that the area was an open woodland with about 30% tree cover (Red Gum). However Skene and Walbran (1948) make no comment as to the vegetation cover.
Previous Maps and Reports
The Wooundellah map unit is named after the main soil type in the area mapped by Skene and Walbran (1948). Most of the area covered by the present mapping unit was mapped as the Valencia Land System by Aldrick et al. (1992).
Soils
The soils of this map unit mainly comprise two soil types mapped by Skene and Walbran (1948). These are Wooundellah loam and Winnindoo loam with the latter occurring in slightly lower positions in the landscape. Wooundellah loam is similar in texture to Winnindoo loam but differs in that it has a deeper surface soil and a browner subsoil with some red mottling. Areas of Nambrok clay loam, a browner version of Wooundellah loam, also occur within this map unit.
In general, the soils of this mapping unit have a sandy loam to clay loam surface soil between 20 and 40 cm deep, generally with a sporadically bleached sub-surface. There is an abrupt change to the mottled medium to heavy clay subsoil with yellowish brown and greyish brown colours dominating. Red mottling also generally occurs in the subsoil. The upper subsoil appears to be generally well structured (parting to fine polyhedral shaped peds). Medium to heavy clays continue to at least 1 m. The soils are generally classified as Brown Chromosols using the Australian Soil Classification.
Adjacent to (and some 6 metres higher than) the Thomson River there is long strip of about 120 ha of gravelly soils in the northern part of this mapping unit. This strip is up to 500 metres wide and over 2 km long and follows the southern bank of the river. The soils are similar to Wooundellah loam but contain moderate to heavy amounts of large water-worn gravel.
Chemical and Physical Analysis
Analyses are provided for two soil pits Site GP65 (previously known as Wooundellah loam) and Site GP67 (previously known as Nambrok clay loam) on this map unit. Skene and Walbran (1948) describe two sites as Wooundellah loam and two more as Winnindoo loam and Wandocka clay loam which are also on this map unit.
The pH of the surface soils is more than 5.5 and the soil profile becomes slightly to strongly alkaline with depth. From the limited data available it would appear that although they are sodic at depth, the immediate subsoil is non-sodic.
GP65. Soil Pit Site (Sargeant and Imhof, 2000)
| Depth cm | Texture | pH | EC dS/m | Cl % | Nitrogen % | Carbon % | Ca meq % | Mg meq % | K meq% | Na meq% | H meq% | ESP % | Coarse sand % | Fine sand % | Silt % | Clay % |
| 0-5 | SL | 5.5 | 0.48 | 0.03 | 0.36 | 3.3 | 4.2 | 1.9 | 1.1 | 0.2 | 12.0 | 24 | 38 | 15 | 16 | |
| 5-15 | SL | 5.5 | 0.19 | 2.0 | 1.1 | 0.5 | 0.4 | 6.0 | 29 | 39 | 15 | 15 | ||||
| 15-25 | SCL | 6.4 | 0.13 | 2.2 | 1.6 | 0.5 | 0.3 | 7 | 30 | 36 | 13 | 21 | ||||
| 25-50 | MC | 6.3 | 0.16 | 3.5 | 7.4 | 1.2 | 0.9 | 4 | 10 | 9 | 6 | 74 | ||||
| 50-65 | SMC | 7.1 | 0.11 | 2.1 | 7.4 | 0.5 | 1.1 | 8.3 | 10 | 29 | 9 | 7 | 56 | |||
| 65-90 | SMC | 7.8 | 0.09 | 1.8 | 8.5 | 0.2 | 1.7 | 14 | 15 | 27 | 12 | 46 | ||||
| 90-120 | MC | 8.0 | 0.11 | 1.6 | 7.1 | 0.2 | 2.0 | 19 |
GP67. Soil Pit Site (Sargeant and Imhof, 2000)
| Depth cm | Texture | pH | EC dS/m | Cl % | Nitrogen % | Carbon % | Ca meq% | Mg meq% | K meq% | Na meq% | H meq% | ESP % | Coarse sand % | Fine sand % | Silt % | Clay % | LAT % |
| 0-15 | FSCL | 5.6 | 0.45 | <.02 | 0.25 | 2.7 | 4.9 | 1.5 | 1.4 | 0.1 | 16 | 39 | 20 | 22 | 2 | ||
| 15-30 | FSCL | 5.9 | 0.12 | 2.6 | 1.0 | 0.8 | 0.3 | 14 | 41 | 21 | 24 | 1 | |||||
| 30-40 | FSCL | 5.9 | 0.07 | 2.0 | 1.4 | 0.8 | 0.1 | 4.8 | 2 | 16 | 38 | 19 | 29 | 1 | |||
| 40-60 | MC | 6.1 | 0.07 | 3.5 | 5.6 | 1.3 | 0.4 | 9.4 | 2 | 8 | 19 | 12 | 62 | 1 | |||
| 60-100 | MC | 7.3 | 0.07 | 2.8 | 7.1 | 0.2 | 1.4 | 13 | 29 | 13 | 10 | 50 | 1 | ||||
| 100-120 | SMC | 6.9 | 0.07 | 3.8 | 9.7 | 0.4 | 1.5 | 10 | |||||||||
| 120+ | SC | 7.7 | 0.07 | 2.5 | 6.4 | 0.2 | 1.3 | 13 |
Wooundellah loam, (Skene and Walbran, 1948)
| Depth cm | Texture | pH | EC dS/m | Cl % | Nitrogen % | Carbon % | Coarse sand % | Fine sand % | Silt % | Clay % | LAT % |
| 0-10 | L | 5.7 | 0.08 | .007 | 0.122 | 1.33 | 11 | 44 | 25 | 17 | 1 |
| 10-25 | FSCL | 6.1 | 0.08 | .006 | 12 | 44 | 25 | 17 | 1 | ||
| 25-30 | CL | 6.0 | .013 | 16 | 36 | 23 | 23 | 1 | |||
| 33-53 | HC | 6.8 | 0.11 | .010 | 6 | 11 | 12 | 66 | 1 | ||
| 53-74 | HC | 7.7 | 0.23 | .027 | 5 | 12 | 13 | 65 | 1 | ||
| 74-96 | HC | 8.4 | 0.40 | .037 | 4 | 13 | 18 | 59 | 1 | ||
| 96-122 | MC | 8.7 | 0.32 | .042 | 1 | 15 | 26 | 51 | 1 | ||
| 122-152 | MC | 9.0 | 0.31 | .034 | 2 | 19 | 30 | 43 | 1 |
Wooundellah loam, (Skene and Walbran, 1948)
| Depth cm | Texture | pH | EC dS/m | Cl % | Nitrogen % | Carbon % | Ca meq% | Mg meq% | K meq% | Na meq% | ESP % | Coarse sand % | Fine sand % | Silt % | Clay % | LAT % |
| 0-10 | L | 6.6 | 0.10 | .004 | .203 | 2.5 | 3.6 | 2.4 | 0.5 | 0.2 | 3 | 11 | 32 | 27 | 20 | 1 |
| 10-20 | FSCL | 6.3 | 0.04 | .002 | 13 | 37 | 19 | 19 | <1 | |||||||
| 20-33 | SC | 6.4 | 0.04 | .002 | 14 | 33 | 25 | 25 | <1 | |||||||
| 33-69 | HC | 6.7 | 0.23 | .003 | 3.7 | 8.9 | 0.8 | 2.0 | 13 | 16 | 9 | 55 | 55 | 1 | ||
| 69-94 | HC | 7.9 | 0.56 | .081 | 6 | 10 | 60 | 60 | 1 | |||||||
| 94-145 | MC | 8.9 | 0.49 | .069 | 0.4 | 9.6 | 0.4 | 2.8 | 21 | 5 | 21 | 41 | 41 | 1 | ||
| 145-218 | SC | 8.7 | 0.28 | .035 | 12 | 35 | 26 | 26 | 1 |
Winnindoo loam, (Skene and Walbran, 1948)
| Depth cm | Texture | pH | EC dS/m | Cl % | Nitrogen % | Carbon % | Gravel % | Coarse sand % | Fine sand % | Silt % | Clay % | LAT % |
| 0-10 | L | 6.0 | 0.05 | .002 | 0.113 | 1.63 | 13 | 44 | 24 | 14 | <1 | |
| 10-20 | SCL | 6.3 | 0.05 | .023 | 15 | 42 | 22 | 19 | 1 | |||
| 20-40 | MC | 7.0 | 0.16 | .021 | 6 | 15 | 29 | 18 | 33 | 1 | ||
| 40-84 | HC | 8.1 | 0.69 | .118 | 5 | 9 | 23 | 14 | 50 | 1 | ||
| 84-112 | MC | 8.4 | 0.75 | .073 | 1 | 6 | 30 | 15 | 45 | 1 | ||
| 112-142 | FSC | 9.0 | 0.49 | .067 | 1 | 9 | 43 | 18 | 28 | 1 | ||
| 142-193 | LC | 8.9 | 0.46 | .060 | 5 | 3 | 24 | 34 | 36 | 1 |
Wandoka clay loam, (Skene and Walbran, 1948)
| Depth cm | Texture | pH | EC dS/m | Cl % | Nitrogen % | Carbon % | Coarse sand % | Fine sand % | Silt % | Clay % | LAT % |
| 0-13 | CL | 5.6 | 0.11 | .009 | 0.188 | 2.39 | 3 | 29 | 32 | 29 | 1 |
| 13-28 | LC | 6.0 | 0.07 | .004 | 2 | 29 | 30 | 36 | <0 | ||
| 28-38 | HC | 6.5 | 0.10 | .009 | 3 | 17 | 19 | 55 | 1 | ||
| 38-64 | HC | 7.3 | 0.27 | .039 | 6 | 12 | 14 | 62 | 1 | ||
| 64-122 | HC | 8.5 | 0.66 | .095 | 1 | 13 | 18 | 62 | 22 | ||
| 122-168 | HC | 8.9 | 0.78 | .108 | <0 | 10 | 19 | 65 | 4 | ||
| 168-183 | HC | 9.1 | 0.82 | .105 | <0 | 5 | 16 | 71 |
Particle size distribution data given for Skene and Walbran (1948, 1949) does not include the water content of the soil. As a result the coarse sand, fine sand, silt, clay and loss on acid treatment (LAT) may not add up to 100%.
Other symbols include: pH - analysed in water; EC - electrical conductivity; Cl - chloride; Ca - exchangeable calcium; Mg - exchangeable magnesium, K - exchangeable potassium; Na - exchangeable sodium; H - exchangeable hydrogen; ESP - exchangeable sodium percentage.
For Soil Pit Sites (Sargeant and Imhof, 2000) exchangeable cations have been determined using Gilman method (where pH >7) and Tucker method (pH <7). Exchangeable Sodium % (ESP) has been calculated here as the percentage of sodium in relation to the sum of the exchangeable basic cations.
Land Use
Most of the soils are irrigated. There was some initial concern that the lighter textured soils of this unit (Wooundellah loam) may be of lower fertility and probably lower carrying capacity. Both dryland grazing and irrigation are carried out on these soils.