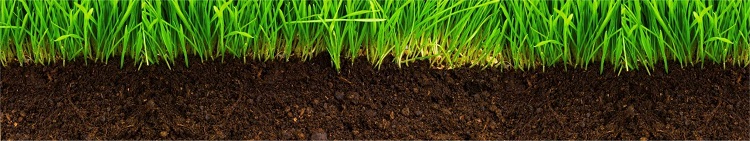
- Plants require nutrients for normal growth. These must be in a form useable by plants
and in concentrations that allow optimum plant growth
- Sixteen nutrients are known to be essential for plant growth. A deficiency in any one of
the 16 essential nutrients will reduce growth and production, even though the others may
be abundantly available. Optimum pasture production can only be obtained if all the
requirements for plant growth are met
|
- This question is using the traditional approach to plant nutrition, known as the Sufficiency Level of Available Nutrient (SLAN) approach, as compared with the alternative approach of Base Cation Saturation Ratios (BCSR)
- Excessive nutrient application can contribute to losses to the environment
|
Understanding the question
|
| Why is it important to me as a farmer?
|
- Matching the nutrients you apply with the nutrients required on the farm will have several
benefits. These include increases in productivity, savings on the fertiliser bill and a
reduction in nutrients lost to the environment
|
|
| How and why nutrient loss / imbalance occurs
|
- Most Australian soils are old and weathered. In fact, many are considered the oldest
soils in the world; and the nutrients have been leached, which has resulted in soils of low
fertility. For example, average Australian soil phosphorus levels are 40% lower than
English soils and up to 50% lower than North American soils
- Improved pasture species allow a much higher stock-carrying capacity; but to maintain
this productivity, they require a higher level of soil fertility than do native pasture species
- Fertiliser applications are required to overcome the soil's inherent nutrient deficiencies
and to replace the nutrients that are lost or removed from the soil by pasture growth,
fodder cropping or conservation, and animal products, such as milk or meat
|
- Nutrient redistribution around the farm and the inherent ability of soils to 'retain' applied
nutrients are other reasons for fertiliser applications
- Nutrient cycling (soil-plant-animal) involves nutrients:
- Being brought onto the farm in various forms
- Undergoing ongoing reactions in the soil
- Being consumed by animals via the plants
- Being lost to the farm system by various means
|
| What nutrients are needed in the paddock?
|
- Sixteen nutrients are known to be essential for plant growth. They can be divided into
two categories:
- Major nutrients (macronutrients)
- Minor nutrients (micronutrients), often referred to as trace elements
Table 1 - Essential nutrients required by plants. - Source: Department of Primary Industries, Victoria
| |
Major Nutrients |
Minor Nutrients
(Trace Elements) |
| |
Carbon (C) |
Molybdenum (Mo) |
| |
Hydrogen (H) |
Copper (Cu) |
| |
Oxygen (O) |
Boron (B) |
| |
Nitrogen (N) |
Manganese (Mn) |
| |
Phosphorus (P) |
Iron (Fe) |
| |
Potassium (K) |
Chlorine (Cl) |
| |
Sulphur (S) |
Zinc (Zn) |
| |
Calcium (Ca) |
|
| |
Magnesium (Mg) |
|
|
- The first three major nutrients, carbon, hydrogen and oxygen, are generally considered
to come from carbon dioxide in the atmosphere and from water. Combined, they make
up 90% to 95% of the dry matter of all plants
- The remaining nutrients are found in the soil and are taken up through the root system of
the plant. However, legumes (such as clovers, lucerne and medics) also have the ability
to convert atmospheric nitrogen into a plant-available form
|
Carbon (C) - What is its optimum level?
- Organic matter (OM) is the total of all organic materials contained within and on soils
- Organic carbon (OC) is the measurement used for calculating OM
- To do this the equation 'OM (g/kg soil) = OC (g C/kg soil) x 1.72' is used. It is
preferable to just use OC as the figure of 1.72 can vary from 1.72 - 2.00
- Typically OC varies with depth and the magnitude of such changes differs between
soil types. Typically OC contents are greatest at the soil surface and decrease
exponentially with depth
- OC is a dynamic soil fraction that has many functions. Therefore it is difficult to
define a single level of OC in a soil at which all functions are optimised
|
- Low OC generally means the soil has 'poor' structure, holds less water and nutrients
Soils with high OC generally have 'good' structure, good water holding capacity and
reduced erosion and nutrient leaching. OC levels will vary according to pasture or
crop type, as well as the original soil type
Table 2 - General OC content for high rainfall areas in Victoria. - Source: Peverill et al. 1999
| |
|
Low |
Normal |
High |
| |
Pastures |
<2.9 |
2.9-5.8 |
>5.8 |
| |
Crops |
<1.5 |
1.5-2.9 |
>2.9 |
|
Nitrogen (N) - What is its optimum level?
- The nitrogen that is readily available to plants is generally measured as nitrate. However
there is no reliable soil test for nitrogen and therefore pasture response relationships for
nitrogen are not possible to develop
- Nitrate levels can be highly variable in soils and nitrate soil tests are unlikely to be of
value in estimating quantitative supplies of soil nitrogen available for most pastures. The
perennial nature of pastures means that the soil nitrate content at any growth stage
usually represents only a fraction of the pasture'syearly requirement
|
- Nitrogen application is a way of producing more feed during the time of reliable moisture.
Each kg of nitrogen per ha on good pasture in winter will produce an extra 5-10kgDM/ha
of growth and in spring 15-20kg DM/ha
|
Phosphorus (P) - What is its optimum level?
- Phosphorus is present in various forms in the soil, only some of which are actually
available to the plant
- Olsen P is a measure of plant available phosphorus. It is the measure of phosphorus
generally used for grazing systems
- Colwell P is a measure of immediately available phosphorus plus the phosphorus that is
absorbed to the soil and released over the next few years. It is the measure used for
cropping systems
- In the Heytesbury dairy region, Olsen-P values are typically high and further applications of P fertiliser are likely to be uneconomic and detrimental to the environment (Greenwood et al 2008)
Table 3 - Availability of P at various Olsen P values. - Source: Target 10, 2005
| |
Olsen P (mg/kg) |
Availability |
| |
Irrigated pastures |
Dryland pastures |
| |
Below 12 |
Below 8 |
Low |
| |
12-17 |
8-12 |
Marginal |
| |
18-25 |
13-8 |
Adequate |
| |
Above 25 |
Above 18 |
High |
Table 4 - Desirable nutrient levels for phosphorus at moderate and high stocking rates. - Source: Nie & Saul, 2006
| |
|
Moderate Stocking Rates (7-12 DSE/ha) |
High Stocking Rates (13-
20 DSE/ha) |
| |
Olsen P |
9 |
15 |
| |
Colwell P |
21 |
35 |
- As a rough guide, to convert Olsen P to Cowell P, multiply Olsen P by:
- 1.6 for sand and sandy loam
- 2.0 for loams
- 3.0 for clays and clay loams
|
- Phosphorus Buffer Index (PBI).
- Phosphorus applied as fertiliser reacts with the soil and becomes less available
for plant uptake. The extent of these reactions depends on the PBI of the soil. A
soil with a high PBI will require more phosphorus fertiliser than a soil with a low
PBI. PBI also shows which soils will leach phosphorus. Soils that have a PBI of
less than 50 are prone to leaching. On these soils phosphorus should be applied
in small quantities on a regular basis over the year, rather than applying all of the
P fertiliser once a year
Table 5 - Capital P (kg/ha) required (in addition to maintenance phosphorus) to lift Olsen P by
one unit. - Source: Target 10, 2005
| |
PBI Class |
PBI |
Phosphorus Required (kg P/ha) |
| |
Very low |
0-50 |
5 |
| |
Low |
50-100 |
7 |
| |
Moderate |
100-200 |
9 |
| |
High |
200-300 |
11 |
| |
Very High |
300-600 |
13 |
| |
Extremely High |
600+ |
15 |
|
Potassium (K) - What is its optimum level?
- Plant requirements for potassium are supplied from two soil sources: exchangeable
potassium that is immediately available and non-exchangeable potassium which is more
slowly available. Clay soils have a higher nutrient holding capacity and need higher
levels of available potassium than sandy soils. Therefore soil test interpretation needs to
be based on soil texture, as the critical value increases with increasing clay content
- Potassium fertiliser is often applied to pastures but rarely to crops in south west Victoria
- Potassium is measured using the Skene K or Colwell K tests. The results are reasonably similar and are expressed in mg/kg (ppm)
Table 6 - Available Potassium (mg/kg). - Source: Target 10, 2005
| |
Nutrient status |
Sands |
Sandy Loams |
Clay Loams |
Clays |
Peats* |
| |
Low |
Below 50 |
Below 80 |
Below 110 |
Below 120 |
Below 250 |
| |
Marginal |
50 - 140 |
80 - 150 |
110 - 160 |
120 - 180 |
250 - 300 |
| |
Adequate |
141 - 170 |
151 -200 |
161 -250 |
181 - 300 |
350 - 600 |
| |
High |
Above 170 |
Above 200 |
Above 250 |
Above 300 |
Above 600 |
*In peat soils, plant tissue testing is suggested as a more accurate indicator of available K
because few field trials have been done to verify laboratory analyses
|
- When potassium levels are high, inputs can be reduced or deleted from fertiliser regime
as a pasture response is unlikely
- In the Heytesbury dairy region, Skene-K values are typically high (see case study 3b) and further applications of P fertiliser are likely to be uneconomic (Greenwood et al 2008)
Table 7 - The critical Colwell K soil test values for four soil texture classes. - Source: Gourley et al. 2007
| |
Soil Texture |
Critical Value (mg/kg) |
Confidence interval (mg/kg) |
Number of experiments |
| |
Sand |
126 |
109-142 |
109-142 |
| |
Sandy Loam |
139 |
126-157 |
122 |
| |
Sandy Clay
Loam |
143 |
127-173 |
75 |
| |
Clay Loam/td>
| 161 |
151-182 |
194 |
- The critical value is the soil test value (mg/kg) at 95% of predicted maximum pasture
yield. The confidence interval is 95% chance that this range covers the critical soil test
value.
|
Table 8 - Recommended nutrient levels for potassium (mg/kg) at moderate and high stocking
rates. - Source: Nie & Saul, 2006
| |
Potassium |
Moderate Stocking Rates (7-12 DSE/ha) |
High Stocking Rates (13-20 DSE/ha) |
| |
Sands |
80-100 |
100-120 |
| |
All other Soils |
120-150 |
150-180 |
Sulphur (S) - What is its optimum level?
- This result needs to be looked at with some caution as there is substantial seasonal variation in plant available sulphur. The variation results from temperature and moisture changes in the soil. This affects both the rate of mineralisation of organic sulphur and sulphur losses due to leaching. It will be lower during dry periods and higher in warm, wet conditions. Therefore the soil test figure should not be used alone to work out
sulphur fertiliser requirements
- When making a fertiliser decision relating to sulphur the following things need to be
considered: Soil type, crop type, seasonal conditions, plant and grain analyses, farm
management practices and local knowledge
- Sulphur levels are impacted by:
- Cultivation - When soil is cultivated the mineralisation of soil organic matter and
release of sulphate-sulphur and other nutrients is accelerated. Sulphur is more
likely to be required in perennial crops and pastures where zero till practices are
used
- OM - soils containing less than 2% OM (approximately 1.2% OC) are likely to be
sulphur deficient. It has been calculated that under favourable conditions for
sulphur mineralisation, for each 1% OM about 6kg of sulphur per hectare per
year is released
- Crops - Canola, high yielding forage crops and grain legume crops need more
sulphur and respond more readily to sulphur application than cereal crops
- Soil texture - leaching of sulphate-sulphur from sandy soils is more likely than
from finer-textured loams and clays
- Sulphur is measured using a test called the KCL 40
|
Table 9 - Sulphur (KCL 40) - Source: Target 10, 2005
| |
Nutrient Level |
Sulphur Level mg/kg (KCL40 test) |
Recommended Capital S application |
| |
Low |
<4 |
30kg S/ha |
| |
Marginal |
4-8 |
15kg S/ha |
| |
Adequate |
9-12 |
7.5kg S/ha |
| |
High |
13-20 |
0 |
| |
Very High |
>20 |
0 |
Table 10 - Recommended nutrient levels for sulphur at moderate and high stocking rates. - Source: Nie & Saul, 2006
| |
|
Moderate Stocking Rates (7-12 DSE/ha) |
High Stocking Rates (13-20 DSE/ha) |
| |
Sulphur KCl-40 |
6.5 |
8.5 |
|
Cation Exchange Capacity (CEC)
- CEC is a measure of the soils capacity to adsorb and hold cations (positively charged ions). CEC can also be referred to as the sum of cations
- A CEC above 15meq/100g means that a soil has a good ability to retain nutrients for plants
- There is considerable evidence that the proportions of the exchangeable cations are more relevant to plant performance than the actual levels
- CEC provides a buffering effect and thus is a major controlling agent of soil structure stability, nutrient availability for plant growth, soil pH and the soils reaction to fertilisers and other ameliorants
- A low CEC value means the soil has low resistance to changes in soil chemistry that are caused by land use e.g. acidification. The CEC of clay minerals is usually in the range of 10 to 150 meq/100g, while that of organic matter may range from 200-400meq/100g. So, the kind and amount of clay and organic matter content of a soil can greatly influence its CEC
- Where soils are highly weathered and the organic matter low, their CEC is also low
- Clay soils with a high CEC can retain large amounts of cations against leaching
- Sandy soils with a low CEC retain smaller quantities of cations
- This is important when planning a fertiliser program. In soils with low CEC, consideration should be given to splitting applications of potassium and sulphur fertilisers
Table 11 - Ratings for CEC - Source: Hazelton & Murphy, 2007
| |
Rating |
CEC (meq/100g) |
| |
Very Low |
<6* |
| |
Low |
6-12 |
| |
Moderate |
12-25 |
| |
High |
25-40 |
| |
Very High |
>40 |
*
Soils with CEC less than 3 are often low in fertility and susceptible to soil acidification
|
Table 12 - Levels of exchangeable cations (meq/100g) - Source: Hazelton & Murphy, 2007
| |
Cation |
V Low |
Low |
Mod |
High |
V High |
| |
Na |
0-0.1 |
0.1-0.3 |
0.3-0.7 |
0.7-2.0 |
>2 |
| |
K |
0-0.2 |
0.2-0.3 |
0.3-0.7 |
0.7-2.0 |
>2 |
| |
Ca |
0-2 |
2-5 |
5-10 |
10-20 |
>20 |
| |
Mg |
0-0.3 |
0.3-1.0 |
1-3 |
3-8 |
>8 |
- The cations manganese, iron, copper, and zinc are usually present in amounts that do not contribute significantly to the cation complement
Table 13 - Desirable percentage range of exchangeable cations for soils - Source: Target 10, 2005
| |
Cation |
Range |
| |
Calcium |
65-80% |
| |
Magnesium |
10-20% |
| |
Potassium |
3-8% |
| |
Sodium |
Less than 6% |
| |
Aluminium |
Less than 1% |
|
Calcium to Magnesium Ratio (Ca:Mg) - What is it meant to be?
- Early research suggested that high soil exchangeable Ca:Mg ratios may induce Mg
deficiency, leading to the view that the Ca:Mg ratio should be between 2 and 7
- Later work from overseas and Australia indicates that yield will be unaffected over a very wide
range of soil exchangeable Ca:Mg ratios
- It has been suggested that provided the
exchangeable Mg is high enough, the ratio can vary over a wide range and will be of little
consequence when there is not a livestock nutritional problem
- The following table shows possible desirable levels for the Ca:Mg ratio
|
Table 14 - Ca:Mg Ratio. - Source: Hazelton & Murphy, 2007
| |
Ca:Mg ratio |
Description |
| |
<1 |
Ca deficient |
| |
1-4 |
Ca (low) |
| |
4-6 |
Balanced |
| |
6-10 |
Mg (low) |
| |
>10 |
Mg deficient |
|
Magnesium to Potassium Ratio (Mg:K) - What is it meant to be?
- The Mg:K ratio can be an important factor under some conditions, e.g. fertilising with
potassium can reduce the uptake of magnesium by grasses being grazed by livestock,
resulting in grass tetany
- Low soil temperature and adequate soil moisture in the
presence of only moderate amounts of potassium result in higher potassium uptake,
compared to magnesium and the development of tetany-prone grass pastures
- Mg:K ratio - less than 1.5 indicates possible grass tetany problems (Target 10)
|
|
Trace Elements - What are they meant to be?
- Soil tests for trace elements are not recommended in Australia because they cannot
reliably predict pasture or crop responses. They are a tool to assist in assessing whether
further investigation is required
- Tissue testing is a far more accurate test of trace
element levels and it usually takes a combination of local knowledge, tissue testing and
strip tests to resolve exactly which elements are required. Fertiliser test strips are good
for determining which fertiliser to use. Be aware that growth responses to molybdenum
may not be apparent until the year after application. Test strips can be put down any
time between May and late August
- For most soils in South West Victoria there is no clear data regarding responses by
pastures to the application of the trace elements zinc, copper, cobalt, boron or
manganese. There are, however, some special cases where experience has shown that
some trace elements are necessary. Molybdenum is the main trace element of interest
for pasture growth in South West Victoria but the level of other elements can be of value
if investigating poor pasture performance and trace element problems with stock,
particularly copper
- Total soil content of trace elements does not indicate the amounts available for plant
growth. For example in spite of high amounts of iron being present in soils, iron
deficiency is very common on calcareous and alkaline soils
|
Table 15 - Desirable levels of trace elements. - Source: Reid & Dirou, 2004
| |
Trace element |
Preferred level in soil (mg/kg) |
| |
Boron |
0.5-4 |
| |
Copper |
2-50 |
| |
Molybdenum |
2 |
| |
Sulphur |
10-20 |
| |
Zinc |
1-200 |
| |
Manganese |
2-25 |
| |
Chloride |
<120 Low, >1200 High |
| |
Iron |
Locks up P applied to pastures and
crops. Lower the better |
|
Other related questions in the Brown Book
|
|
Brown Book content has been based on published information listed in the Resources and References sections below
|
- Baxter, N., and Williamson, J., (2001) Know Your Soils: Part 1 - Introduction to Soils. Department of Natural Resources and Environment, Vic.
- Bluett, C., and Wightman,B. (1996) Cropping in South-West Victoria. Depatment of Primary Industries, Victoria.
- Field, D.J., McKenzie, D.C., and Koppi,, A.J., Development of an Improved
Vertisol Stability Test for SOILpak,.Australian Journal of Soil Research, 35:842-52,
CSIRO Publishing.
- Gourley, C.J.P., Melland, A.R., Waller, R.A., Awty, I.M., Smith, A.P., Peverill, K.I.,
Hannah, M.C., (2007) Making Better Fertiliser Decisions for Grazed Pastures in
Australia. Department of Primary Industries, Victoria.
- Hazelton, P., and Murphy, B., (2007) Interpreting Soil Test Results - What do all the
numbers mean. 2nd edition, CSIRO Publishing, Melbourne.
|
- Nie, Z., and Saul, G., (2006) Greener Pastures for South West Victoria,. 2nd Edition,
Department of Primary Industries, Hamilton.
- Price, G., (2006)Australian Soil Fertility Manual. 3rd edition, CSIRO Publishing,
Melbourne.
- Peverill, K. I., Sparrow, L.A., and Reuter, D.J. (1999) Soil Analysis an Interpretation
Manual. CSIRO Publishing, Melbourne.
- Ried, G., and Dirou, J., (2004) How to Interpret your Soil Test. Department of Primary
Industries, NSW.
- Target 10 (2005) Fertilising Dairy Pastures, 2nd edition. Department of Primary Industries, , Melbourne.
|
|