Victorian Resources Online (archived)
Diagrammatic representations of Terrace development
The following animation shows how terraces are created by stream activity over hundreds of thousands of years. Click on the animation to start.
We have detected that the browser used to view this content is missing the supported 'Flash Player plugin'. You need to install the Adobe Flash Player to see this video.
![]()
Once you have installed the 'Flash Player plugin' found on the Adobe website, please return to this web page by using the back button on your browser.
A transcript of the terraces animation is available.
 Figure 1: Deposition of the sediments on which the Briagolong Unit soils are formed. |
 Figure 2: Erosion of the Briagolong land-surface following a period of uplift or sea level change |
 Figure 3: Valley in-filled with later sediments on which the Stratford Unit soils are formed |
 Figure 4: Erosion of the Stratford Unit land-surface following a period of uplift or seal level change. |
 Figure 5: Valley in-filled with later sediments (Qp6a, 6b) - see table below |
Geological Subdivision | Landform | Landform Elements | Map Unit |
Qp6a | Terrace | Terrace plain | |
Qp6b | Stagnant alluvial plain | Levee | |
Backplain | |||
Dune | |||
Swamp |
 Figure 6: Major sea level change associated with the last ice age resulted in erosion of late Pleistocene sediments |
 Figure 7: Present floodplains of Newry, Thomson, and La Trobe Units become in-filled with sediments |
 Figure 8: Generalised cross-section between Heyfield and north of Latrobe River near Rosedale (diagrammatic only - not to scale) |
 Figure 9: Generalised cross-section across Avon River and related terraces (diagrammatic only - not to scale) |
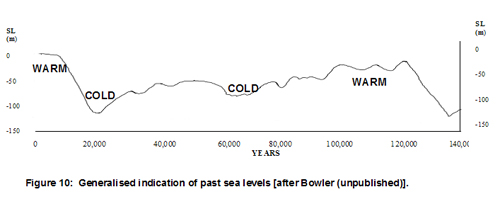 Figure 10: Generalised indication of past sea levels |