Erosion  and Landslide Resources in the CCMA Region   
 
HomeIntroduction | Definitions | User GuideMaps & ReportsDisclaimer        


Inventory Maps
Definition, Intended Use and Limitations 1. Landslide Inventory Maps
Click on area of interest or select from list below:
Detailed 25K maps can be viewed by selecting desired  shire/city map. 
The following inventory maps primarily provide information on the spatial location of erosion and landslides within the Corangamite Catchment Management Authority (CCMA) region. Other information such as classification, volume, activity and date of occurrence may also be available but is dependent on the primary source of data from which the erosion or landslide occurrence has been mapped.

Generally, the inventory for the CCMA region has been assembled using mapped occurrences from aerial photography and data from historic records including unpublished state government and consultant’s reports.

This inventory must not be considered to be a complete record of all erosion or landslides within the study area. It is an interpretation of erosion and landslide processes based on the original methods of data capture used including subjective aerial photo interpretation (API). As such, the data is limited to some degree by the availability, scale and quality of aerial photography or by the experience and interpretive skills employed by field staff and others involved in the analysis and interpretation of data.
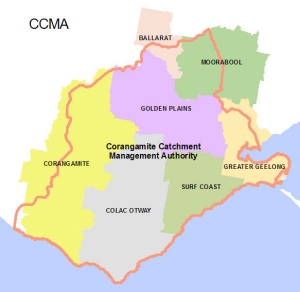
CCMA (15.11 MB)
City of Ballarat 
Colac-Otway Shire 
Corangamite Shire
City of Greater Geelong
Golden Plains Shire
Moorabool Shire
Surf Coast Shire
The inventory has been compiled from a diverse range of data sources varying in quality, scale and method of data capture. Further detailed information on data sources is contained on individual map legends and in the accompanying report entitled:
“Erosion and Landslide Inventory for the CCMA Region”.  
Supporting document to the Corangamite Soil Health Strategy. 
Report No: 357.1/01/07.
Date 30 June 2007. 
Prepared by A.S. Miner Geotechnical.

The inventory has been compiled using a Geographic Information System (GIS) format utilising ArcView 9.1. Mapped occurrences were scanned at a minimum resolution of 200 dpi and georeferenced using the VicMap 1:25,000 hydrography layer and coastline data for control. Third-order polynomial transformations were then applied resulting in a best fit. 

The positional accuracy of individual erosion or landslide occurrences is directly related to the initial data capture method and source information. Specific data on positional accuracy is contained in the metadata files for each data source. As a guide, positional accuracy may range from +/- 25 m to +/-200 m.

The current inventory maps have been used as the basis for the accompanying Erosion Susceptibility and Landslide Susceptibility maps which have a stated intended scale of use of 1;25,000. The inventory maps are also intended for use at a maximum scale of 1:25,000 and limitations with positional accuracy, data capture method and feature interpretation are duly recognised and acknowledged.

Disclaimer

Top of Page

 
2. Erosion Inventory Maps
Click on area of interest or select from list below:
Detailed 25K maps can be viewed by selecting desired  shire/city map.
CCMA (14.95 MB)
City of Ballarat 
Colac-Otway Shire
Corangamite Shire
City of Greater Geelong
Golden Plains Shire
Moorabool Shire
Surf Coast Shire

Produced by AS Miner Geotechnical
Copyright 2007