The definition of susceptibility mapping adopted in this study involves the classification, spatial distribution and area of existing and potential hazards in the study area. It includes potential areas for hazards on the basis of like conditions observed at the sites of existing hazards.
In particular the landslide susceptibility mapping involved the development of a landslide inventory
recording landslides which have occurred in the past (but of unspecified age) and an assessment of the areas with a potential to experience
landslides in the future but with no assessment of frequency. Due to the scale and nature of the mapped occurrences, the landslide mapping only refers to moderate to deep-seated rotational and translational landslides with limited
run-out capacity.
The maps have been produced with an intended scale of use of 1:25,000. The maps are considered to be a reasonable to good representation of susceptibility at this scale
but should not be used for either this or other purposes at scale larger than 1:25,000.
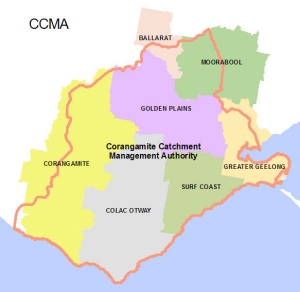
The regions bounded by the local government areas of Colac-Otway Shire and the City of Greater Geelong have undergone more extensive assessment in comparison to other areas in the CCMA region due to the current collaborative arrangements between these municipalities and the
CCMA.
It is important to recognise the limitations of the current susceptibility maps associated with the GIS modelling process. The major limitation with any data mining and training process is the accuracy of the initial inventory. As described in the section on inventory mapping,
data limitations associated with positional accuracy, data capture method, source data quality and feature interpretation are duly recognised and acknowledged.
In addition, other data sets not available at the time of initial modelling such as wetness index and 2nd derivative layers from the Digital Elevation Model (DEM) such as flow accumulation, profile curvature and plan curvature could also be expected to further enhance the accuracy of the susceptibility model. The availability of a more accurate and higher resolution DEM in the future will also allow significant advances in the model detail
An important aspect to remember at all times when using these susceptibility maps is that the
susceptibility depicted is only a modelled version of reality and there is no substitute for detailed on-site appraisal by a qualified geotechnical practitioner in the assessment of the potential susceptibility to landslides for a specific site.
|
2. Erosion Susceptibility Maps:
|
