Erosion and Landslide Resources in the CCMA Region   
HomeIntroduction Definitions | User Guide | Maps & ReportsDisclaimer        


Happy Valley - Historical Landslide Trends

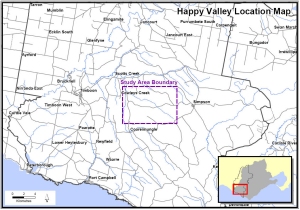
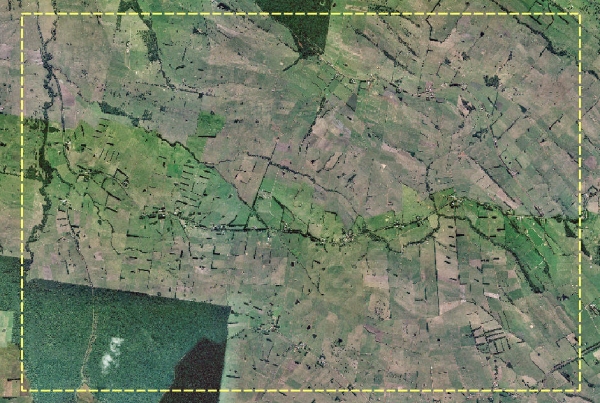
Location  and Aerial Maps
Analysis
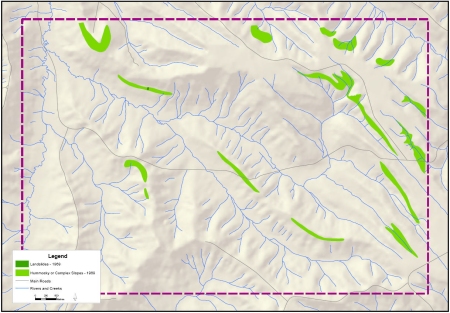
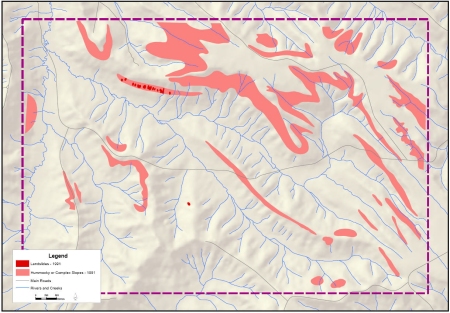
Landslide Trend Maps
Inventory and Susceptibility Comparison Maps
Other Landslide Trend Areas
 
Location Map Aerial Map 2003
Click on image to enlarge Click on image to enlarge
Analysis
Landslide Study Date Count Area (ha) % change from 1969 % study area
1969 Landslide 1 0.28 0.00 0.004%
1969 Hummocky or Complex Slope 15 196.62 0.00 3.138%
Total 1969 16 196.90 0.00 3.143%
1991 Landslide 13 5.22 1764.29 0.083%
1991 Hummocky or Complex Slope 28 743.48 273.55 11.723%
Total 1991 41 739.70 275.67 11.806%
Total Study Area 6265.38
 
Landslide Trend Maps
Happy Valley 1969 (West 1993)
 Click on image to enlarge
Happy Valley 1991 (West 1993)
 Click on image to enlarge
 
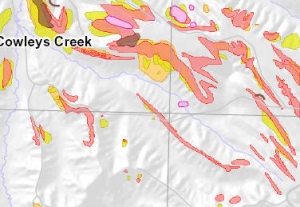
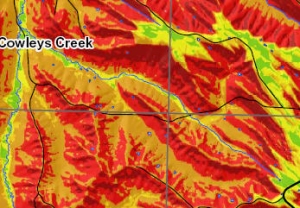
Inventory and Susceptibility Comparison Maps for Happy Valley Study Area
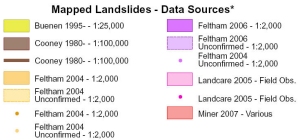
Landslide Inventory Comparison Landslide Inventory Legend
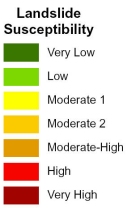
Landslide Susceptibility Comparison Landslide Susceptibility Legend

Top of Page


Produced by AS Miner Geotechnical
Copyright 2007