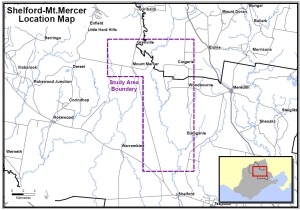
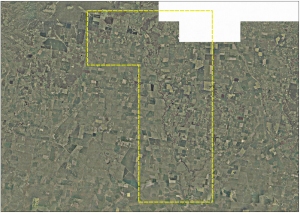
| Location Map | Aerial Map 2004 | ||
 |
 |
||
| Click on image to enlarge | Click on image to enlarge | ||
| Analysis | |||
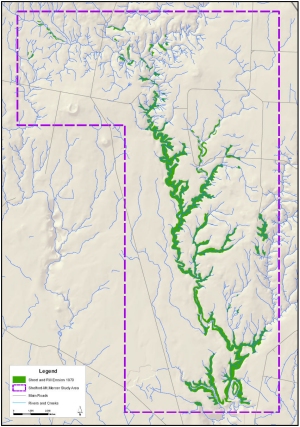
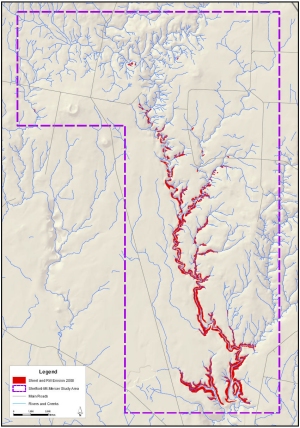
| Sheet and Rill Erosion Trend Analysis | |||
| Erosion Study Date | Count (polygons) |
Area (ha) | % change from 1970 | % study area |
| 1970 | 52 | 1,472.55 | 0.00 | 5.82% |
| 2000 | 83 | 683.98 | -53.55 | 2.70% |
| Total Study Area | 25,316.01 | |||
| Gully and Stream Bank Erosion Trend Analysis | |||||||||||||||||||||||||||
|
|||||||||||||||||||||||||||
| Top of Page | |||||||||||||||||||||||||||
| Sheet-Rill Erosion Trend Maps | |||||||||||||||||||||||||||
 |
 |
||||||||||||||||||||||||||
| Shelford-Mt. Mercer 1970
(Roberts 2006) Click on image to enlarge |
Shelford-Mt. Mercer 2000
(Roberts 2006) Click on image to enlarge |
||||||||||||||||||||||||||
| Gully and Streambank Erosion Trend Maps | |||||||||||||||||||||||||||
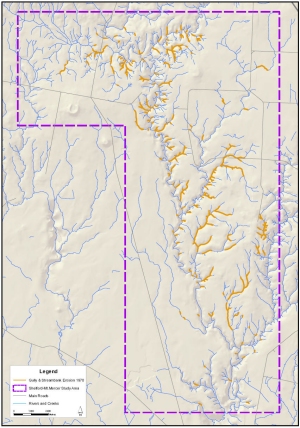 |
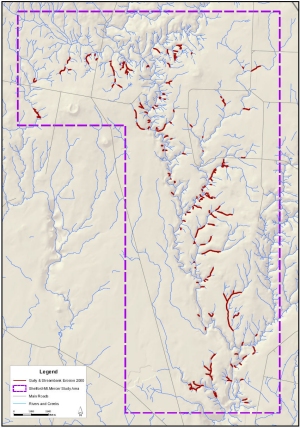 |
||||||||||||||||||||||||||
| Shelford-Mt. Mercer
1970
(Roberts 2006) Click on image to enlarge |
Shelford-Mt. Mercer
2000
(Roberts 2006) Click on image to enlarge |
||||||||||||||||||||||||||
| Top of Page | |||||||||||||||||||||||||||
| Inventory and
Susceptibility Comparison Maps for Shelford-Mt. Mercer Study Area |
|||||||||||||||||||||||||||
 |
 |
||||||||||||||||||||||||||
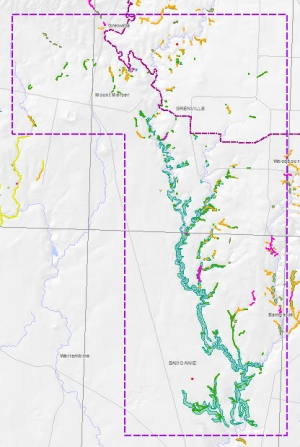
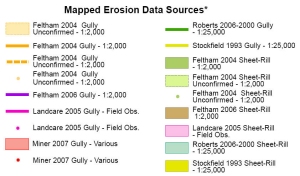
| Erosion Inventory
Comparison (Click on image to enlarge) |
Erosion Inventory Legend | ||||||||||||||||||||||||||
 |
 |
||||||||||||||||||||||||||
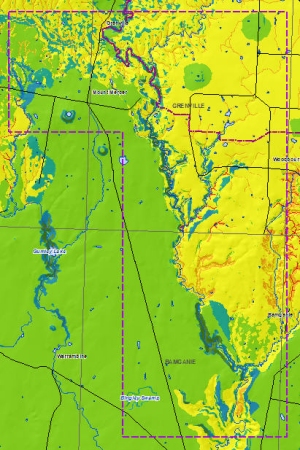
| Gully Erosion
Susceptibility
Comparison (Click on image to enlarge) |
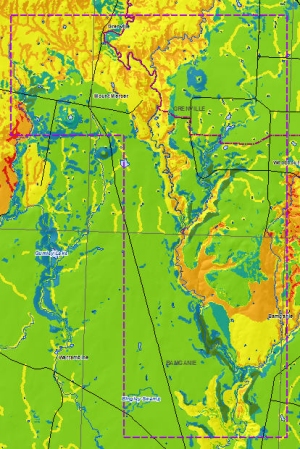
Sheet and
Rill Erosion Susceptibility
Comparison (Click on image to enlarge) |
||||||||||||||||||||||||||
 |
 |
||||||||||||||||||||||||||
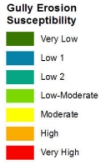
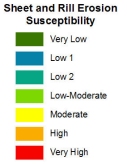
| Gully Erosion Susceptibility Legend | Sheet and Rill Erosion Susceptibility Legend | ||||||||||||||||||||||||||